

Tutorial: Analyze PlantEye data with R-Studio
During the training and consulting of our clients we noticed that some of our users are eager to dive deeper into the data our tools provide, like plant morphological and spectral data. We know our academic users value open source data, for instance to publish alongside their scientific papers. The numerical data is ready to use with any statistical analysis software, therefore we constructed a quick guide that covers the topics related to getting started with Phenospex Data in R.
The tutorial page covers the following actions:
- Data import
- Data conversion
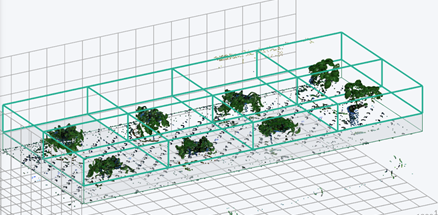
- Data visualization
- Data filtering
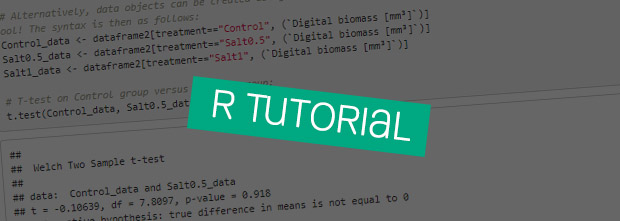
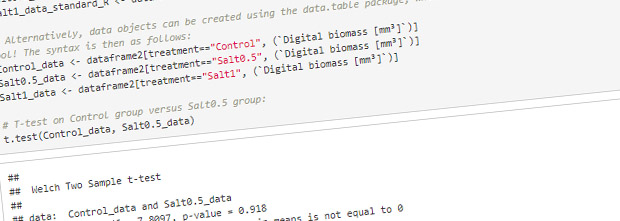
- Hypothesis testing
Proof of concept – hypothesis testing in R
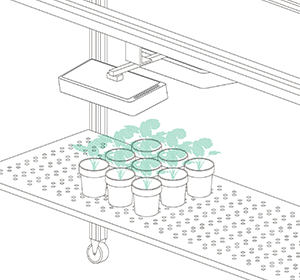
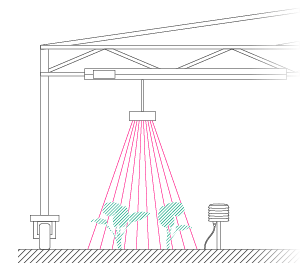
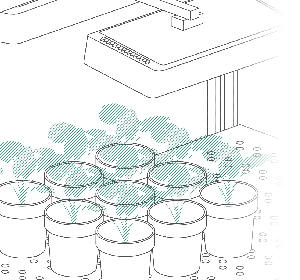
In order to generate a basic data set that would allow for hypothesis testing, a pilot experiment was performed with 8 basil plants. Two of the plants were assigned as control plants, and the remaining 6 were given a salt stress treatment.
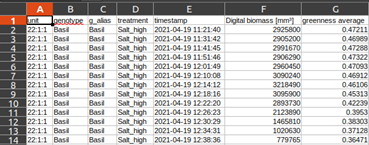
As a complete walkthrough we created an easy to use tutorial. Start working on PlantEye data immediately by downloading the experiment’s CSV spreadsheet and the original R-script below.
R-scripts & Experiment data download:
Generate a download link and receive it on your mail:
Get R Studio
R Statistical Software and R Studio are both free to use software packages, and can be downloaded at the following pages respectively: https://cran.r-project.org/bin/windows/base/ and https://www.rstudio.com/