

Bayer Validates PlantEye for Automated Efficacy Screening on Soybeans
Year: 2021
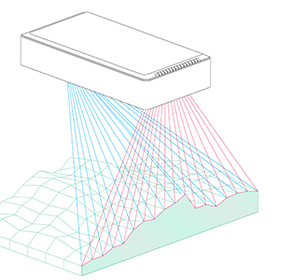
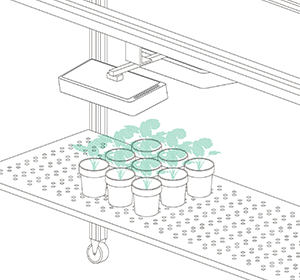
Sensor: PlantEye F400 DualScan
Product: FieldScan
Client: Bayer Crop Science
Reading time: 7-8 minutes
Classic plant phenotyping methods, which typically involve manual and often destructive measurements, are increasingly being supplemented by advanced digital tools like PlantEye. This technology allows for non-destructive, high-throughput, automated and accurate measurements of essential plant traits, thereby enhancing the evaluation of numerous factors.
By integrating PlantEye into their phenotyping processes, Bayer Crop Science aims to overcome the limitations of traditional methods and speed up the discovery and implementation of effective agricultural solutions. This approach not only streamlines the development of new products but also enhances the predictability and applicability of research outcomes in real-world agricultural settings.
“Classic plant phenotyping methods including hand-held measurement tools and destructive harvests are laborious, time-consuming, subjective, and, in some cases, provide only endpoint measurements” as the researchers team led by Lakshmi Praba Manavalan wrote in their paper.
Enhancing Efficacy Screening: Validating PlantEye’s Performance for Agricultural Research
However, before these tools can be confidently deployed in screening applications, it is crucial to understand their performance thoroughly under diverse conditions. Such a validation process is vital for Bayer’s Crop Science team to ensure that the data obtained from PlantEye can reliably guide decisions in agricultural research and development.
In their validation efforts, Bayer’s team demonstrated that measurements of leaf area and digital biomass by PlantEye correlated strongly with traditional destructive measurements using the well-established LI-COR system: R² PlantEye leaf area vs manually measured leaf area = 0.91
Further validation confirmed PlantEye’s ability to identify active agents known from traditional methods, demonstrating that it effectively distinguishes between effective and non-effective treatments. This capability makes PlantEye a valuable tool in efficacy screening, comparable to manual plant phenotyping in terms of specificity and treatment separation.
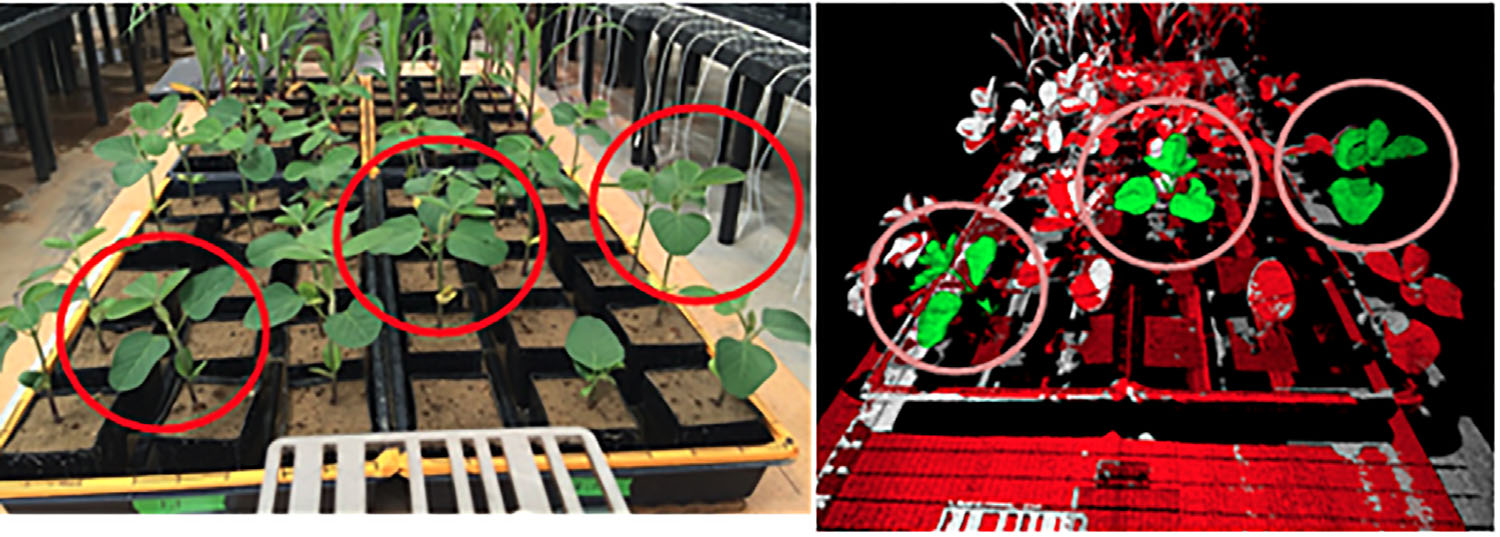
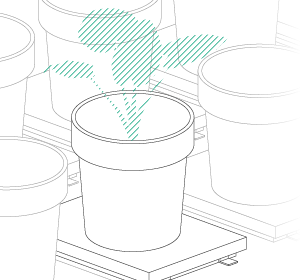
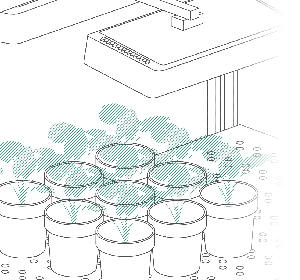
Figure 1: Original plant (left) and PlantEye F400 generated 3D visualization (Right)
The need for automation and digital phenotyping in efficacy screening
By developing biological products to promote growth or protect crops, Bayer Crop Science wants to contribute to more sustainable agriculture. This aligns with the main objective of Phenospex to make farming better for our planet. “The growing demand for agricultural biological products is attributed to their low environmental impact and manufacturing costs, both key contributors driving the expected future expansion of the segment’s market growth,” according to Manavalan et. al.
However, the current throughput is limited by the manual and labor-intensive nature of traditional phenotyping measurements in large-scale studies. Furthermore, if an effect occurs early in the experiment, it might not be significant at the end, leading to potential “false negatives”—agents that have an effect but are not detected. If a product has an effect at an early stage, but not at a later stage, this is an indication the dosage, activity or stability of the applied product is to be optimized. This can result in costly oversights as competitors may discover these effects later.
With this in mind Manavalan et. al. decided to select PlantEye as the sensor has shown promise in creating non-destructive time series that visualize effects as they occur, making it a chosen sensor for these studies. Additionally, PlantEye addresses issues like small sample sizes and minor effects, common in biologicals or biostimulants, by providing comprehensive high-quality morphological data. The PlantEye saves time and increases the volume of data by delivering data at multiple points in time while not impacting the precision.
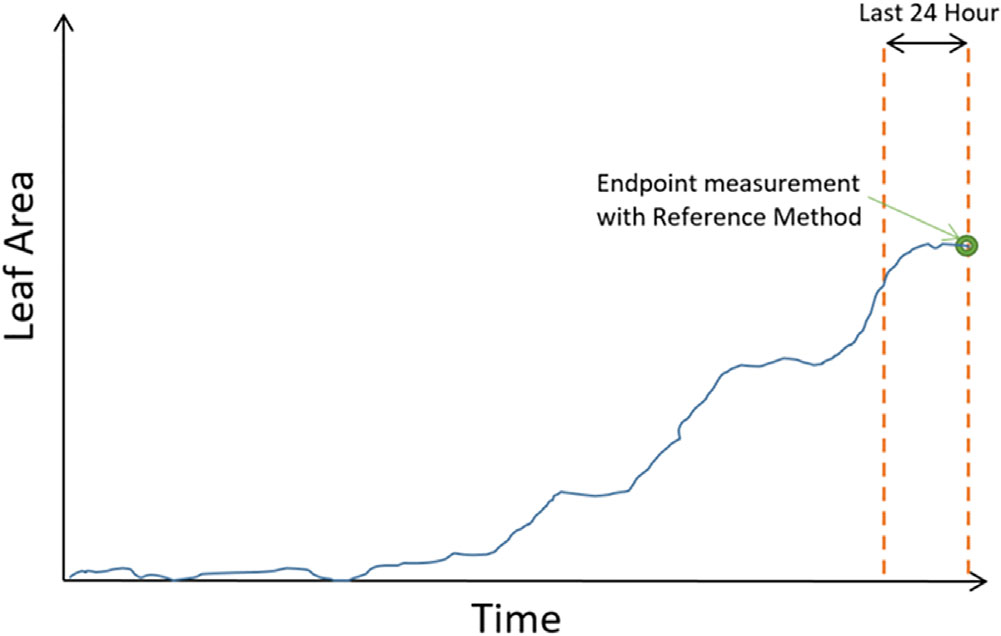
Figure 2: Typical PlantEye time-series profile
Validating PlantEye: A Crucial Step for Scientists
Before adoption of the PlantEye into product screening, it’s essential for scientists to validate PlantEye’s effectiveness for their specific needs. Lakshmi Praba Manavalan and her team at Bayer Crop Science in West Sacramento, CA, authored the mentioned paper validating the PlantEye sensor for effective screening of chemical compounds, followed by a direct comparison with the classic method. This comparison is crucial for ensuring PlantEye’s data reliability and utility across various applications in agricultural research and crop management.
The research study on soybeans revealed that comparing traditional destructive and manual measurements of leaf area using LI-COR with those from PlantEye showed a robust correlation of 0.91. This strong correlation emphasizes PlantEye’s reliability and accuracy in capturing plant traits, especially in measuring total leaf area.
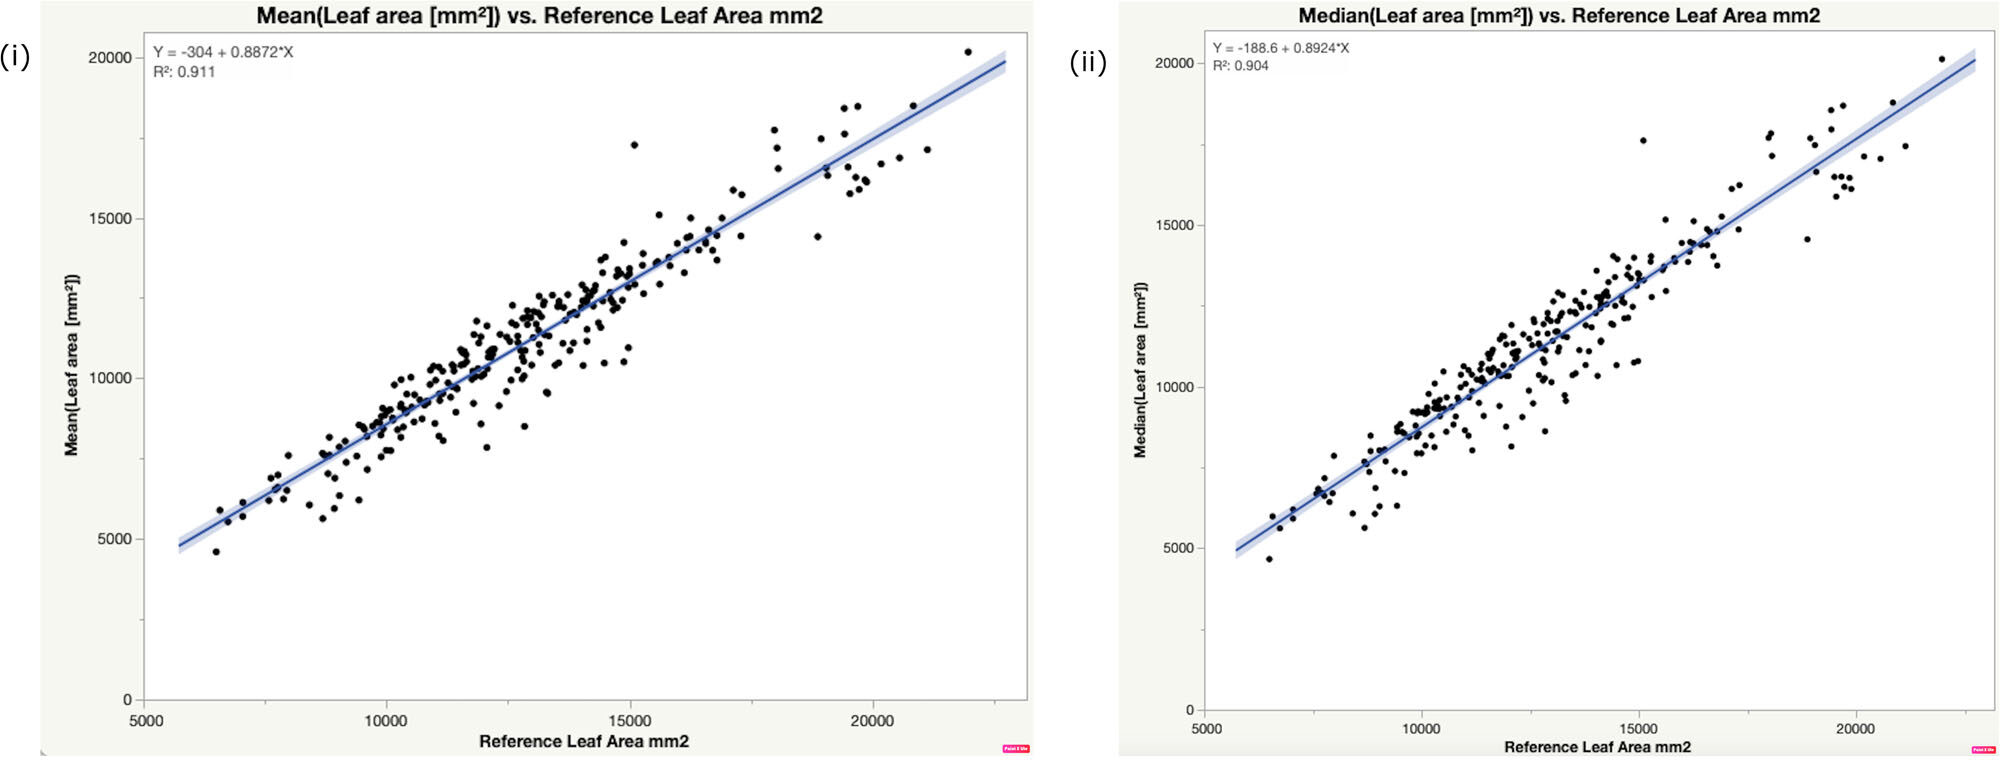
Figure 3: In their validation efforts, Bayer’s team demonstrated that measurements of leaf area and digital biomass by PlantEye correlated strongly with 0.91 and 0.89, respectively with traditional destructive measurements using the well-established LI-COR system.
This strong correlation underscores the reliability and accuracy of PlantEye in capturing plant phenotypic characteristics, particularly in measuring total leaf area. According to Manavalan et. al. the implementation of such technologies allows organizations to make decisions based on a richer dataset and potentially improves decision quality for the development of novel crop protection or crop efficiency treatments.
The validation of the non-destructive PlantEye system, which provides comprehensive digital time-series data, marks a significant milestone in agricultural research, demonstrating its utility in enhancing the efficiency of discovering effective biological treatments. Its ability to provide detailed, real-time phenotypic data promises to accelerate decision-making processes and improve the development of new crop protection strategies. “The usage of high-throughput digital phenotyping platforms not only increases efficiency, but also has the potential to enhance effectiveness of screening studies by incorporating nondestructive measurements repeatedly throughout the development of plants,” the study explains.
Validating the application with Overlapping Area Ratio (OAR)
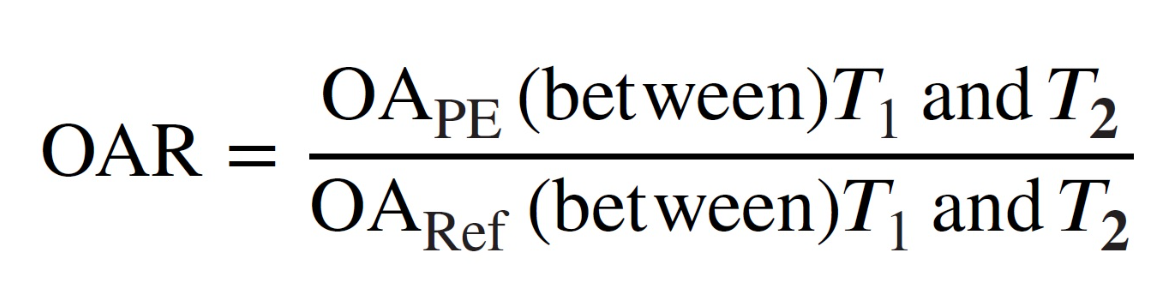
Additionally, new quantitative metrics developed from these studies, like Overlapping Area Ratio (OAR), provide a deeper understanding of variation comparability between measurement methods, enhancing the trust in digital phenotyping technologies. It is a quantitative metric to compare the separability of treatment groups between datasets obtained from different measurement methods. OAR is expressed as the ratio between the overlapping area (OA) of each measurement method.
It actually can be used to validate any type of chemical in an efficacy screening system. Using the comparison method OAR, the team has demonstrated that PlantEye separates the treatment groups equally effectively as opposed to traditional destructive measurement, taking into account factors such as soil type and plant location.
The system not only saves hundreds of hours but also offers insights into plant growth dynamics that are not possible with traditional endpoint measurements. “Based on an efficiency perspective, the deployment of the PE system in this case study in screening efforts will save us an estimated 120 hr per year and provide additional data points, such as plant growth rate over time, as opposed to only two end-point measurements”, as the authors of the study summarized.
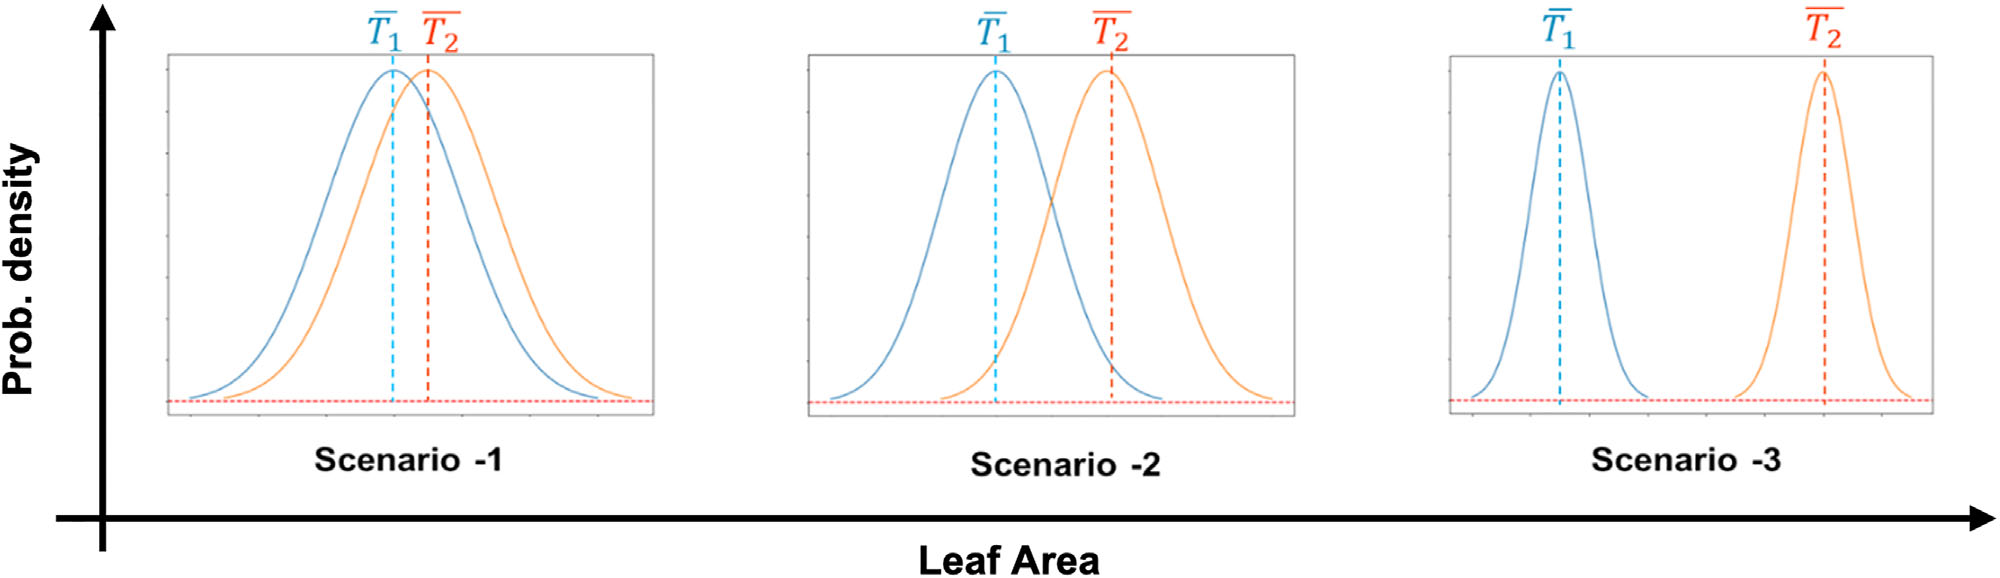
Figure 4: Possible scenarios for phenotypic effect of two microbial treatments Scenario 1: Treatment 2 has slightly better average effect than Treatment 1. However, due to the large variabilities, it is difficult to distinguish the two treatments. Scenario 3: Treatment 2 has far better average effect than Treatment 1, and it is easy to distinguish the two treatments due to small variabilities. Scenario 2: This scenario lies somewhere in between the above two scenarios.
Note
This paper presents data generated using our F400 sensor. Given that the F600 sensor offers significantly higher resolution, it is likely that even more accurate results could be obtained. For more information on the F600, click here.
reference list
Manavalan, L. P., Cui, I., Ambrose, K. V., Panjwani, S., DeLong, S., Mleczko, M., & Spetsieris, K. Systematic approach to validate and implement digital phenotyping tool for soybean: A case study with PlantEye. Plant Phenome J, 2021; 4:e20025. https://doi.org/10.1002/ppj2.20025
Contact us for more information
Would you like more information, a quote or a free consult? Contact us now and learn all about our digital phenotyping solutions and how they can fit in your process.