

University of Nebraska Validates PlantEye as the New Standard for High-Throughput Chlorophyll Assessment
96% Accuracy and a fast workflow. Manual chlorophyll sampling is the bottleneck of modern phenotyping. Independent data from University of Nebraska-Lincoln (UNL) proves that PlantEye delivers research-grade accuracy (R2 = 0.96) across your entire crop in a fraction of the time. Replace the handheld meter with a validated, automated standard that sees what the human eye misses.
For decades, the handheld SPAD meter has been the undisputed—yet labor-intensive—benchmark for non-destructive chlorophyll measurement. However, as phenotyping scales up, the limitations of “point-and-click” manual sampling are becoming a bottleneck for global research. The question is no longer just about speed, but about whether a localized leaf measurement can truly represent the physiological health of an entire plant.
In a landmark study conducted at the University of Nebraska-Lincoln (UNL), researchers put our PlantEye 3D-spectral sensor to the test against traditional SPAD-502 measurements. The goal was simple: to determine if automated, high-throughput scanning could not only match but exceed the reliability of manual methods.
The results, independently verified by UNL, provide a definitive answer. By achieving a high correlation coefficient (R2 = 0.834) between PlantEye’s digital NDVI and manual chlorophyll readings, this research marks a pivotal shift in plant science. We are moving away from the “sampling bias” of single-leaf measurements toward a new, validated standard: Automated Whole-Plant Phenotyping.
SPAD vs. PlantEye
 |
 |
| Figure 1: Left: Example of one individual 3D plant model from one scan with NDVI values. Right: Picture of a soybean plant highlighting each SPAD measurement location in yellow. | |
SPAD vs. PlantEye: Key Differences
The SPAD meter is a non-invasive tool that provides an instantaneous measurement of leaf absorbance in the red and near-infrared (NIR) wavelengths, generating a relative chlorophyll content score ranging from -9.9 to 199.9. It is a non-destructive chlorophyll measurement. The core challenge with the SPAD meter is not the sensor itself, but the human element. To get a truly representative chlorophyll value for a single plant, a technician must manually measure multiple leaves at different heights. This process is not only exhausting but introduces “Subjective Selection”—the tendency to measure the healthiest-looking tissue. Additionally, chlorophyll concentration varies significantly between leaf levels.
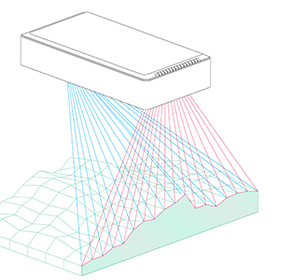
PlantEye, on the other hand, utilizes 3D scanning and spectral imaging to assess leaf reflection across the entire plant in the red, blue, green, and NIR regions. Our experiments demonstrate that focusing solely on specific canopy levels can obscure a plant’s true physiological status (Figure 2).
 |
 |
 |
 |
| Figure 2: Correlation between PlantEye NDVI and SPAD measurements across different canopy levels (Upper, Middle, Lower, All). From left to right: R2 = 0.447, R2 = 0.129, R2 = 0.621, R2 = 0.834 |
|||
By automating the process and digitizing the entire plant, we can minimize false negatives, remove the position effect completely, and capture reliable insights faster and more precisely. These are just a few reasons why we at Phenospex want to make digital phenotyping the standard!
Can a Multispectral Device Measure Chlorophyll at All?
The answer is a definitive yes. While it avoids destructive extraction, PlantEye quantifies chlorophyll indirectly through the Normalized Difference Vegetation Index (NDVI).
This index relies on how leaf biology interacts with light: healthy leaves with high chlorophyll content absorb most Red light for photosynthesis, while reflecting Near-Infrared (NIR) light to prevent overheating. By measuring these reflections, we can calculate plant health using the following formula:
A value close to 1 indicates a lush, healthy plant. Because these spectral changes often occur before the human eye can see physical wilting or yellowing, NDVI is the ideal parameter for early plant stress detection.
Evaluation Experiments: Can PlantEye measure Chlorophyll content?
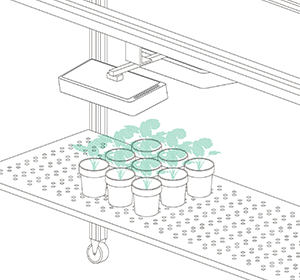
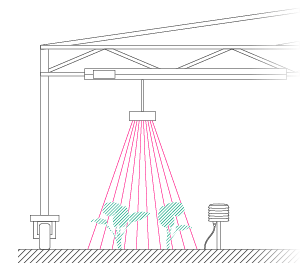
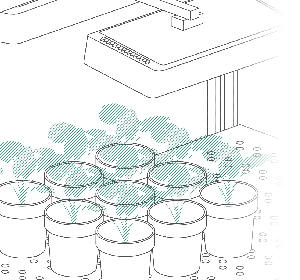
To test the limits of PlantEye’s spectral sensitivity, we collaborated with the University of Nebraska, conducting a controlled Nitrogen (N) starvation experiment on maize plants. The experiment involved treating maize plants with four distinct nutrient solutions: FN (Full Nitrogen), MN (Moderate Nitrogen), LN (Low Nitrogen), and NN (No Nitrogen).
To validate the digital data produced by PlantEye, the researchers of UNL went to the source: destructive chemical extraction. They harvested leaf tissue samples, extracted the chlorophyll in the lab, and compared those “ground truth” concentrations to PlantEye’s NDVI measurements and traditional handheld SPAD meter readings for a complete picture (Figure 3).
 |
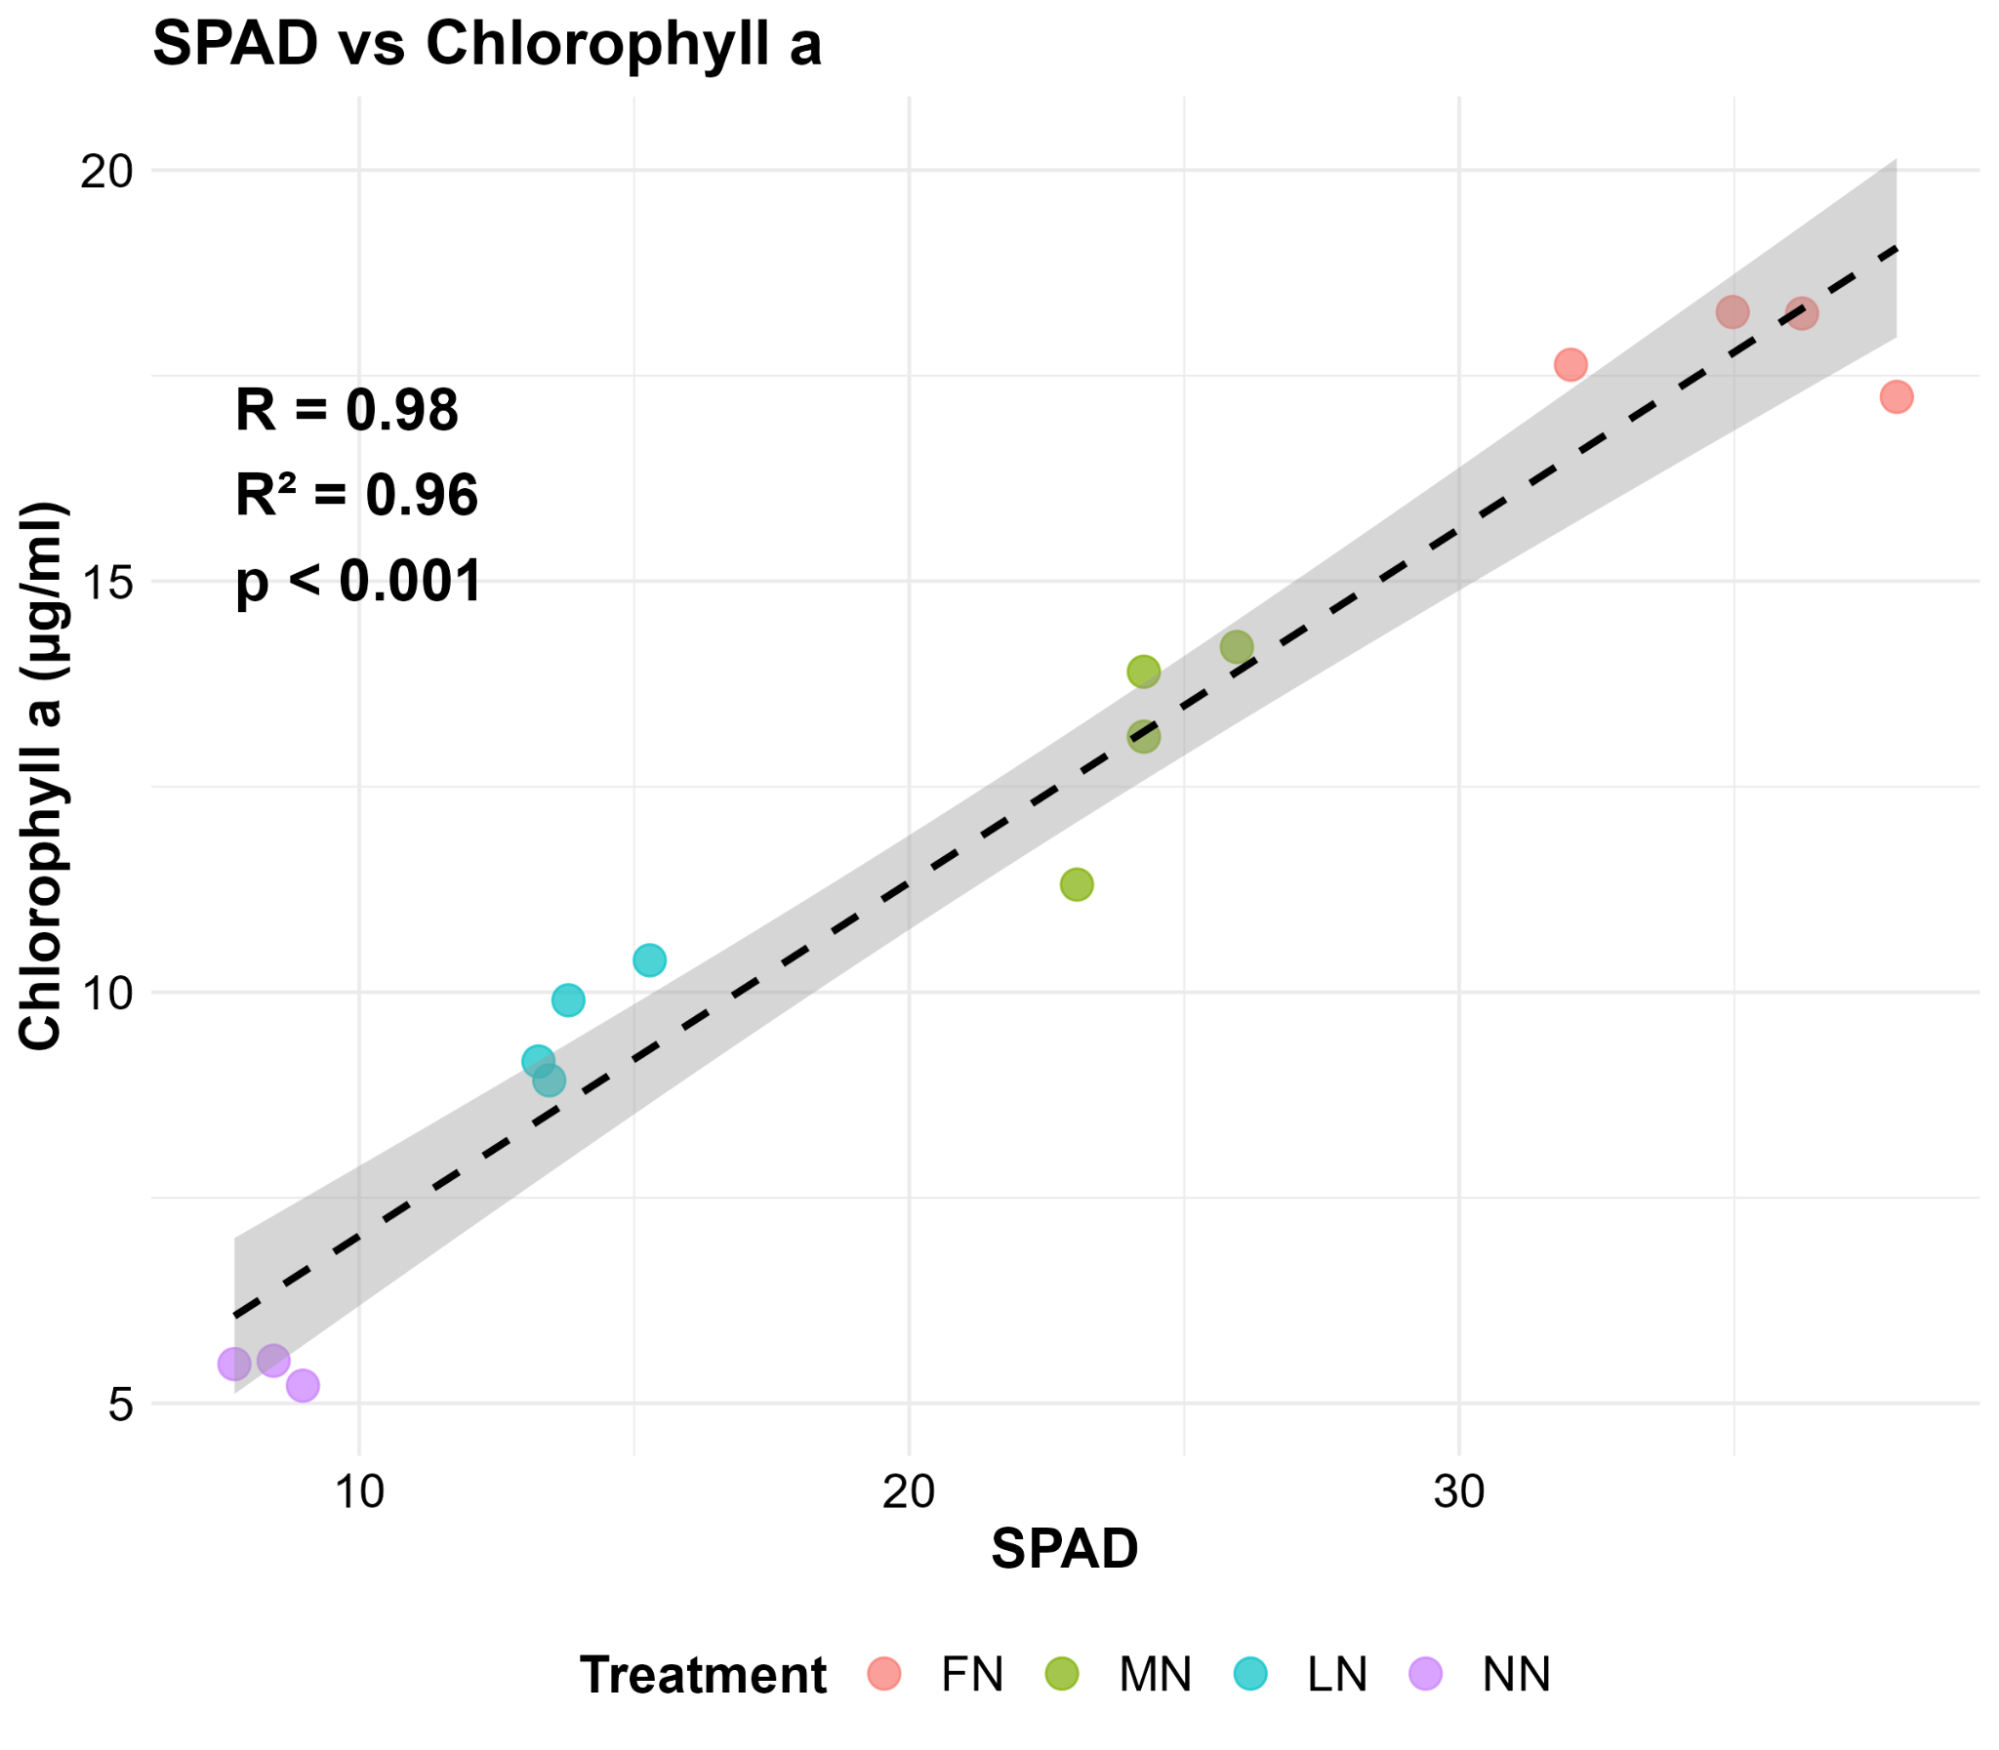 |
| Figure 3: Side-by-side comparison of correlations with ground truth. Left: Scatter plot of PlantEye NDVI data vs. ground truth chlorophyll measurements (R=0.96). Right: Scatter plot of SPAD measurements vs. ground truth chlorophyll measurements (R=0.98). |
|
The data showed a Pearson correlation coefficient of R = 0.98 for the SPAD and R = 0.96 for PlantEye’s NDVI. While the SPAD’s slightly higher correlation is expected, since it measured the exact same tissue as the lab, PlantEye’s result is arguably more significant. It proved that a high-speed, automated scan of the entire 3D canopy is just as reliable as manual, point-based sampling. Using HortControl, these values can be processed and visualized instantly across the whole trial.
Proving Statistical Significance
PlantEye is not only faster than the SPAD meter while maintaining equal reliability; it is also sensitive enough to statistically distinguish between every single level of nitrogen stress, as shown in Figure 4.
| NDVI Analysis by Treatment | Minimum Percentage Difference |
 |
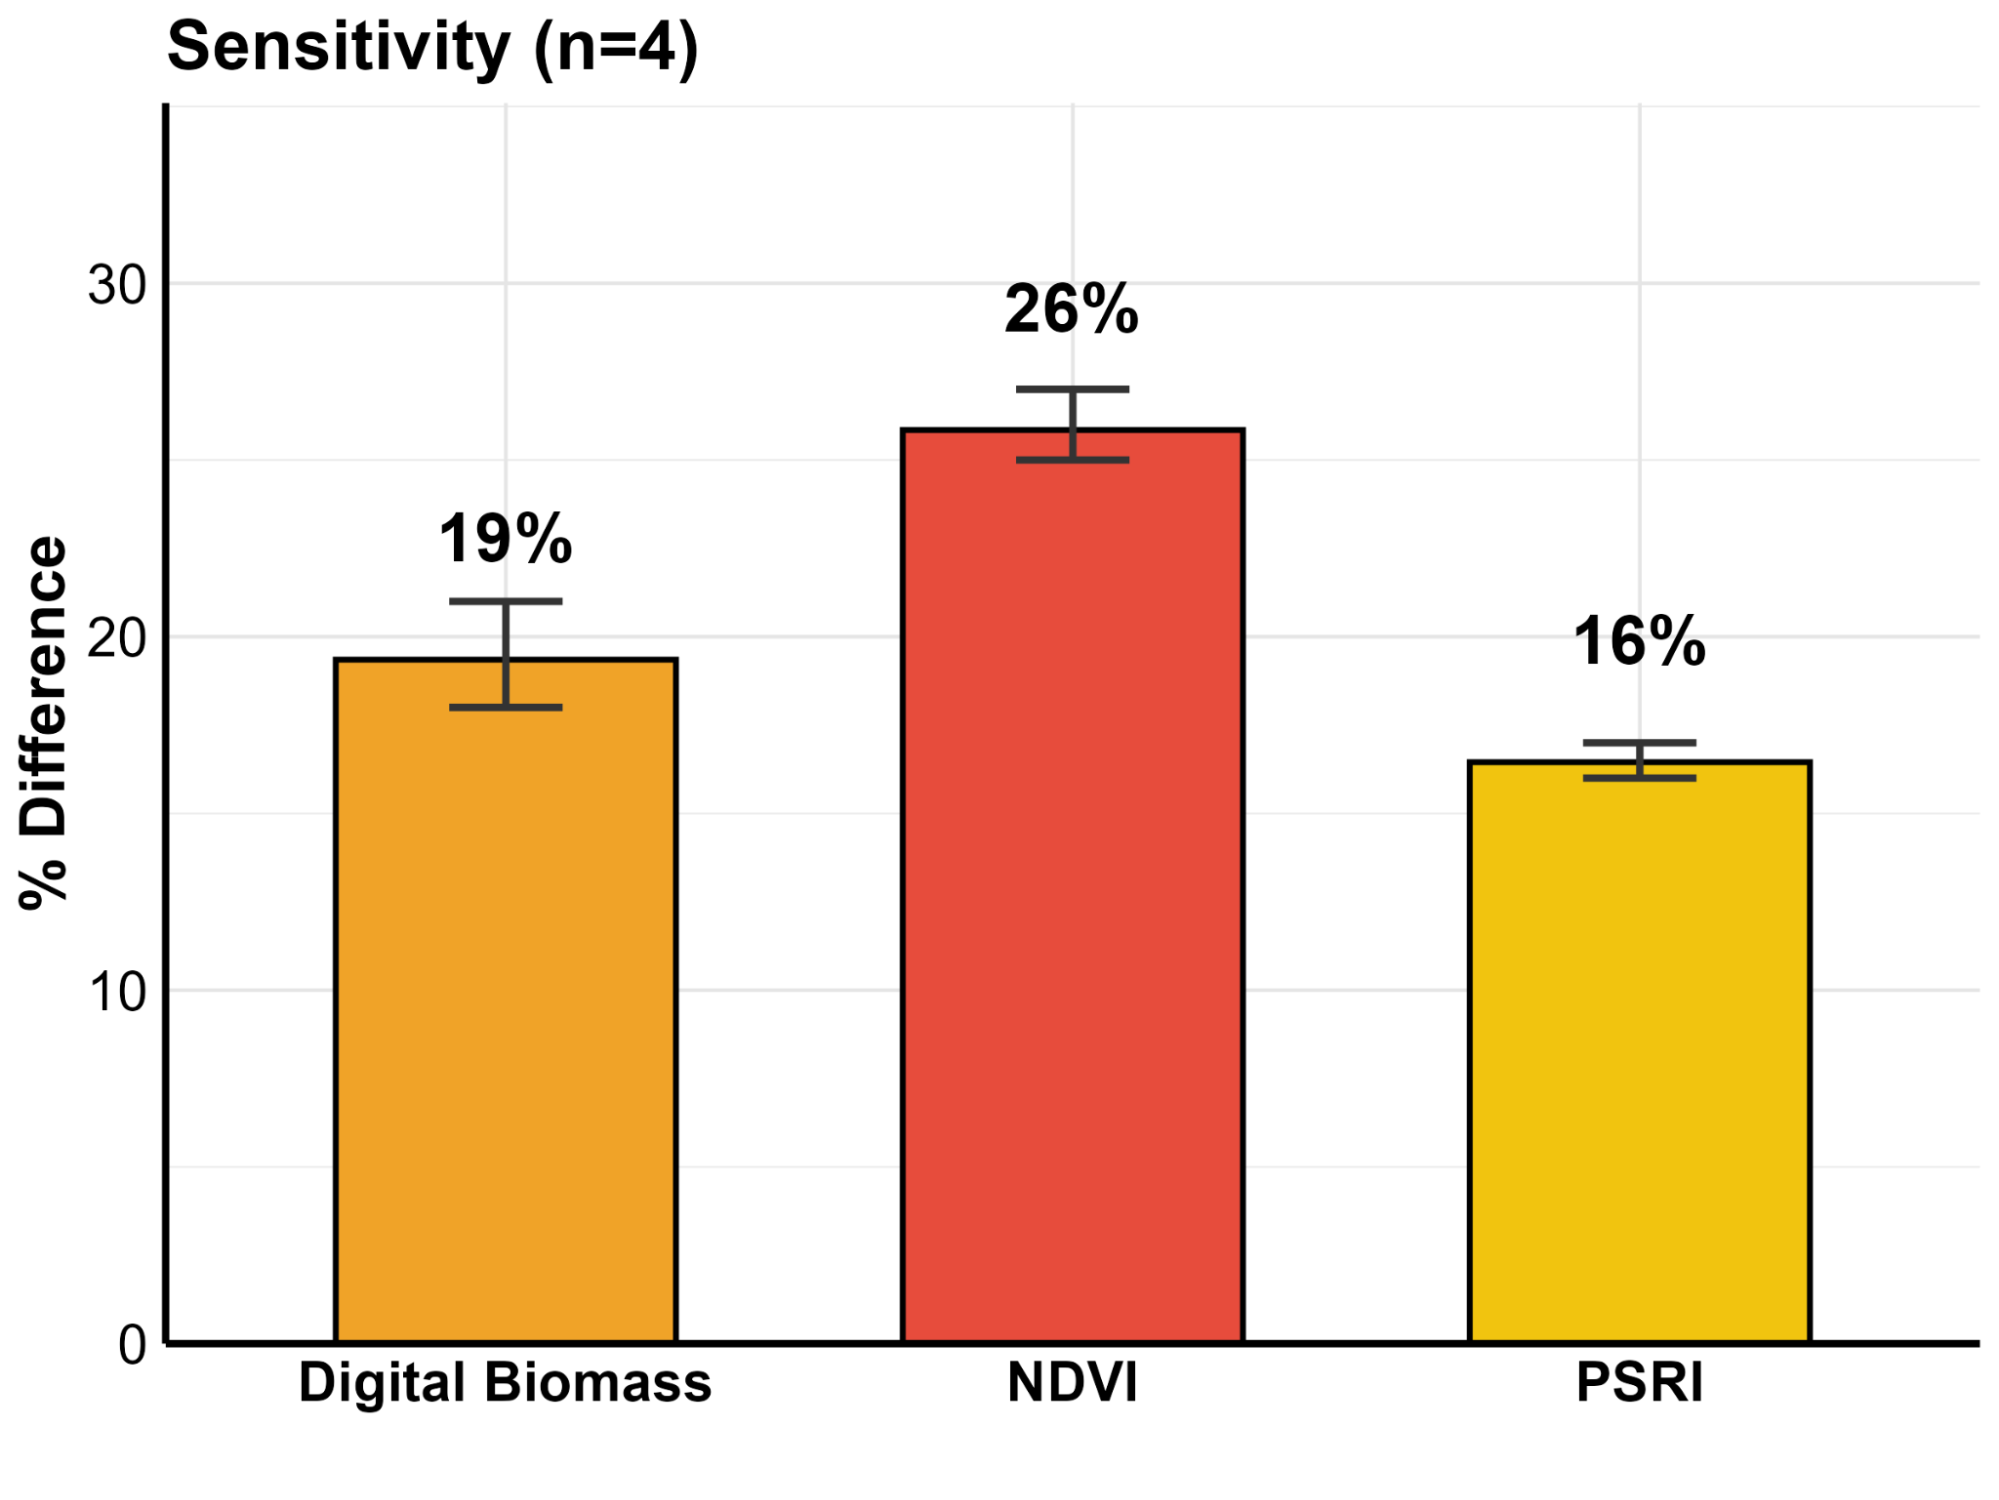 |
| Figure 4: Left: Boxplot of NDVI values across four nitrogen application levels: Full Nitrogen (FN), Moderate Nitrogen (MN), Low Nitrogen (LN), and No Nitrogen (NN). Different letters (a, b, c, d) indicate statistically significant differences between treatments (p < 0.05) based on Fisher’s LSD test. Right: Result of a power analysis based on 6,000 simulations to determine experimental replicate requirements at 80% statistical power. Minimum percentage difference detectable using four replicates for digital biomass, NDVI, and PSRI. | |
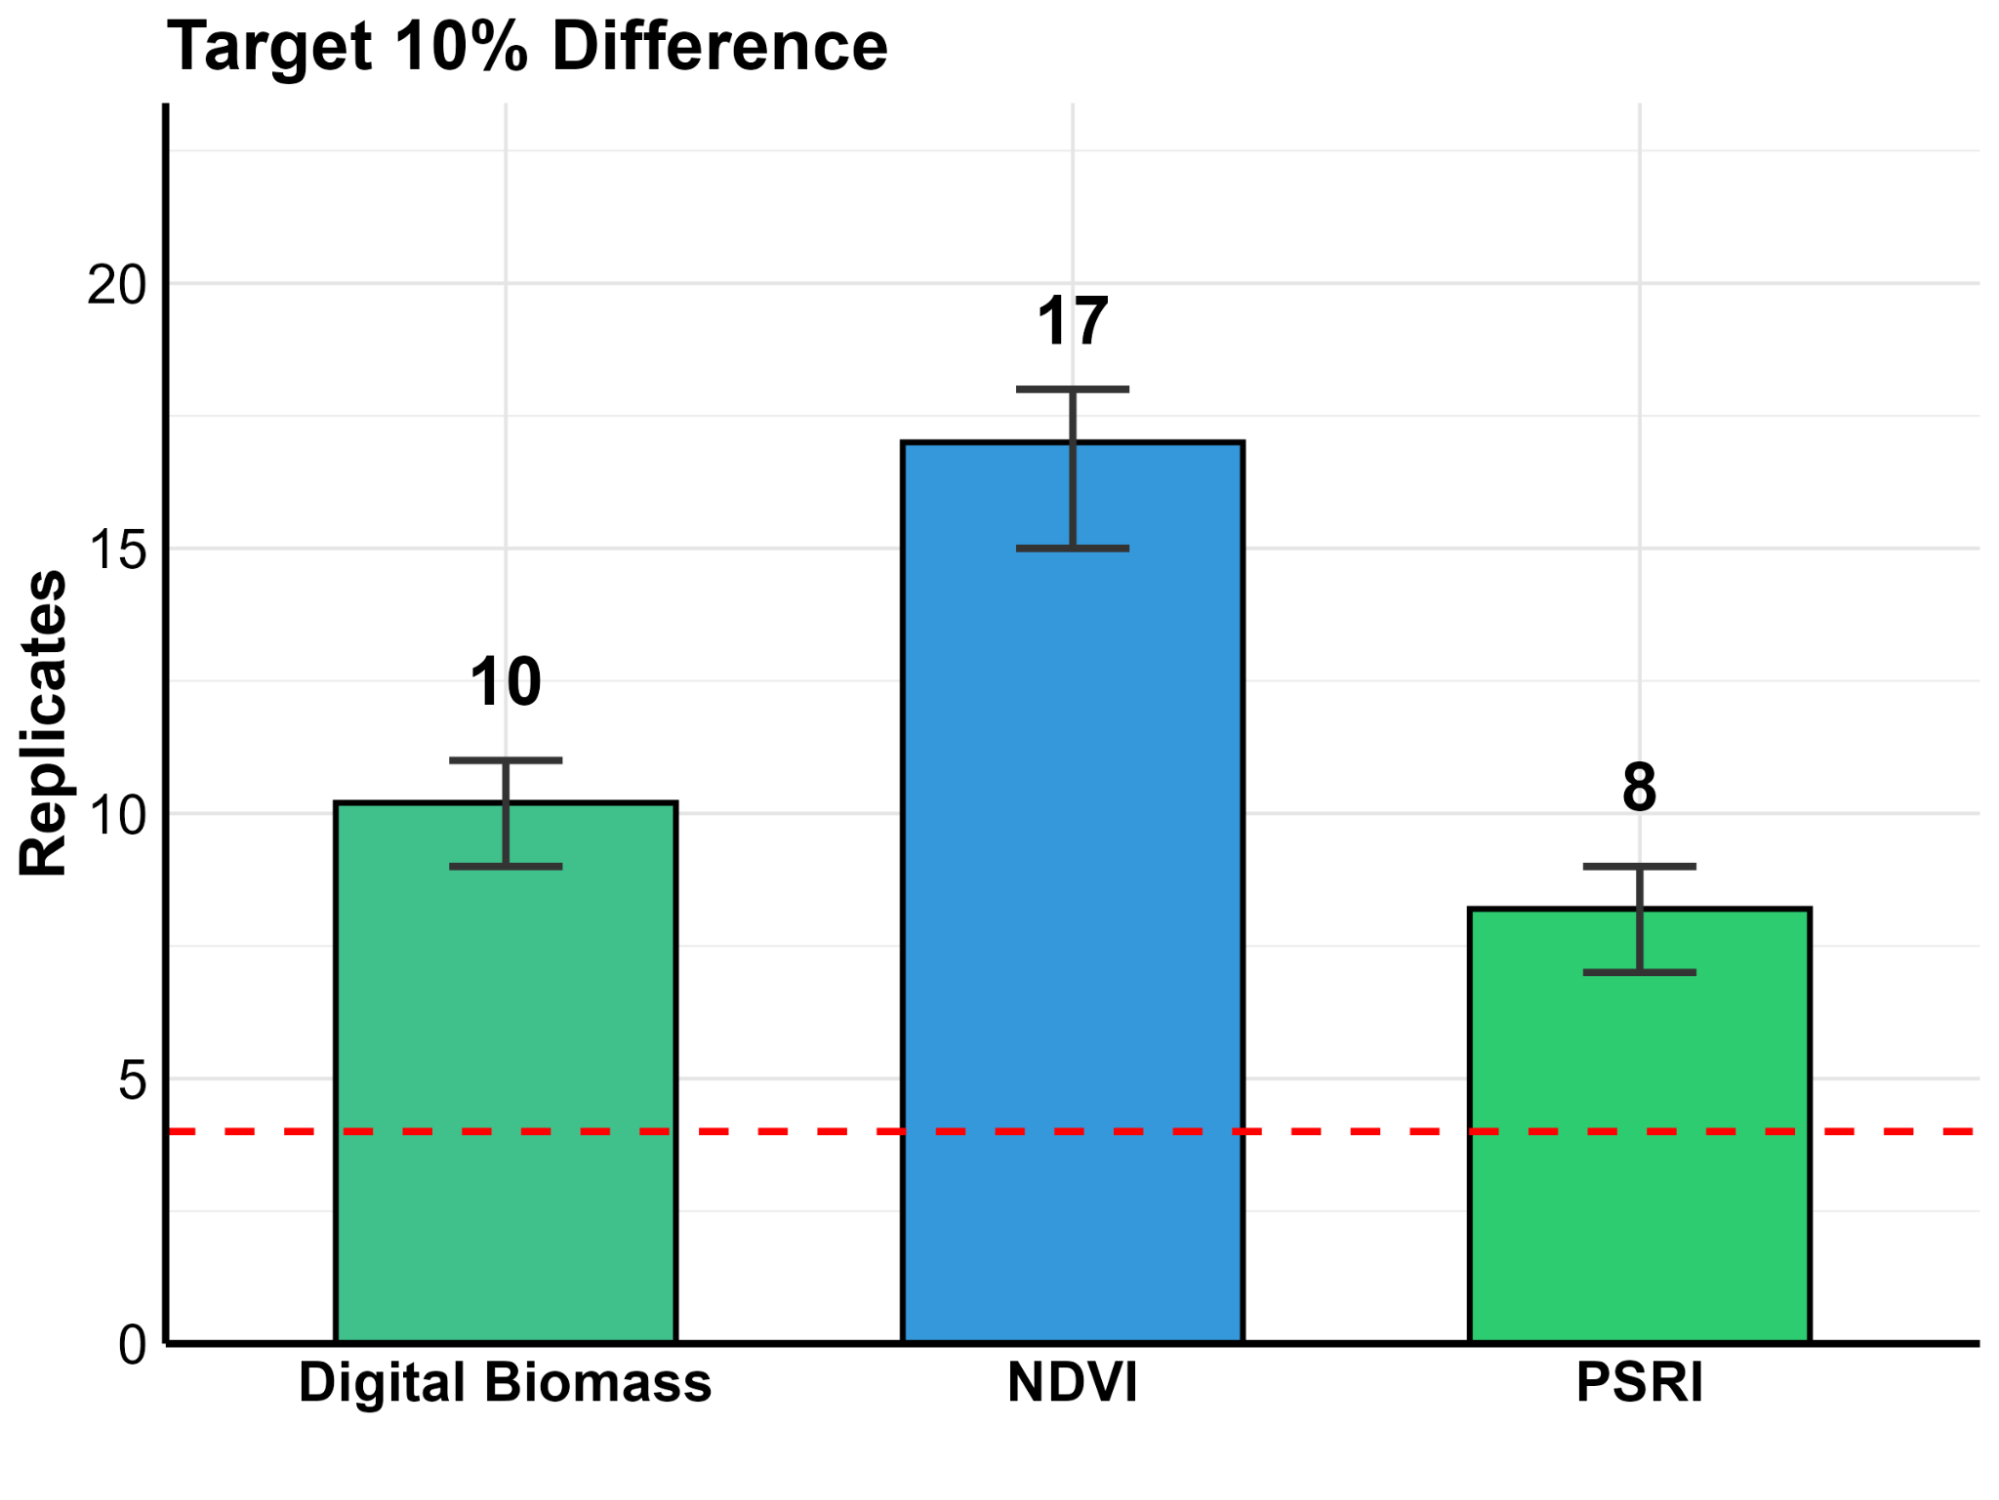
In plant science, “noise” is the enemy. Manual measurements are often limited by human error and small sample sizes, making subtle changes hard to prove. To solve this, we developed a simulation script based on our University of Nebraska experimental data (Figure 5). By running 6,000 virtual simulations, we determined how many replicates are needed to detect specific changes in plant health with 80% statistical power.
Replicate Comparison by Parameter
 |
 |
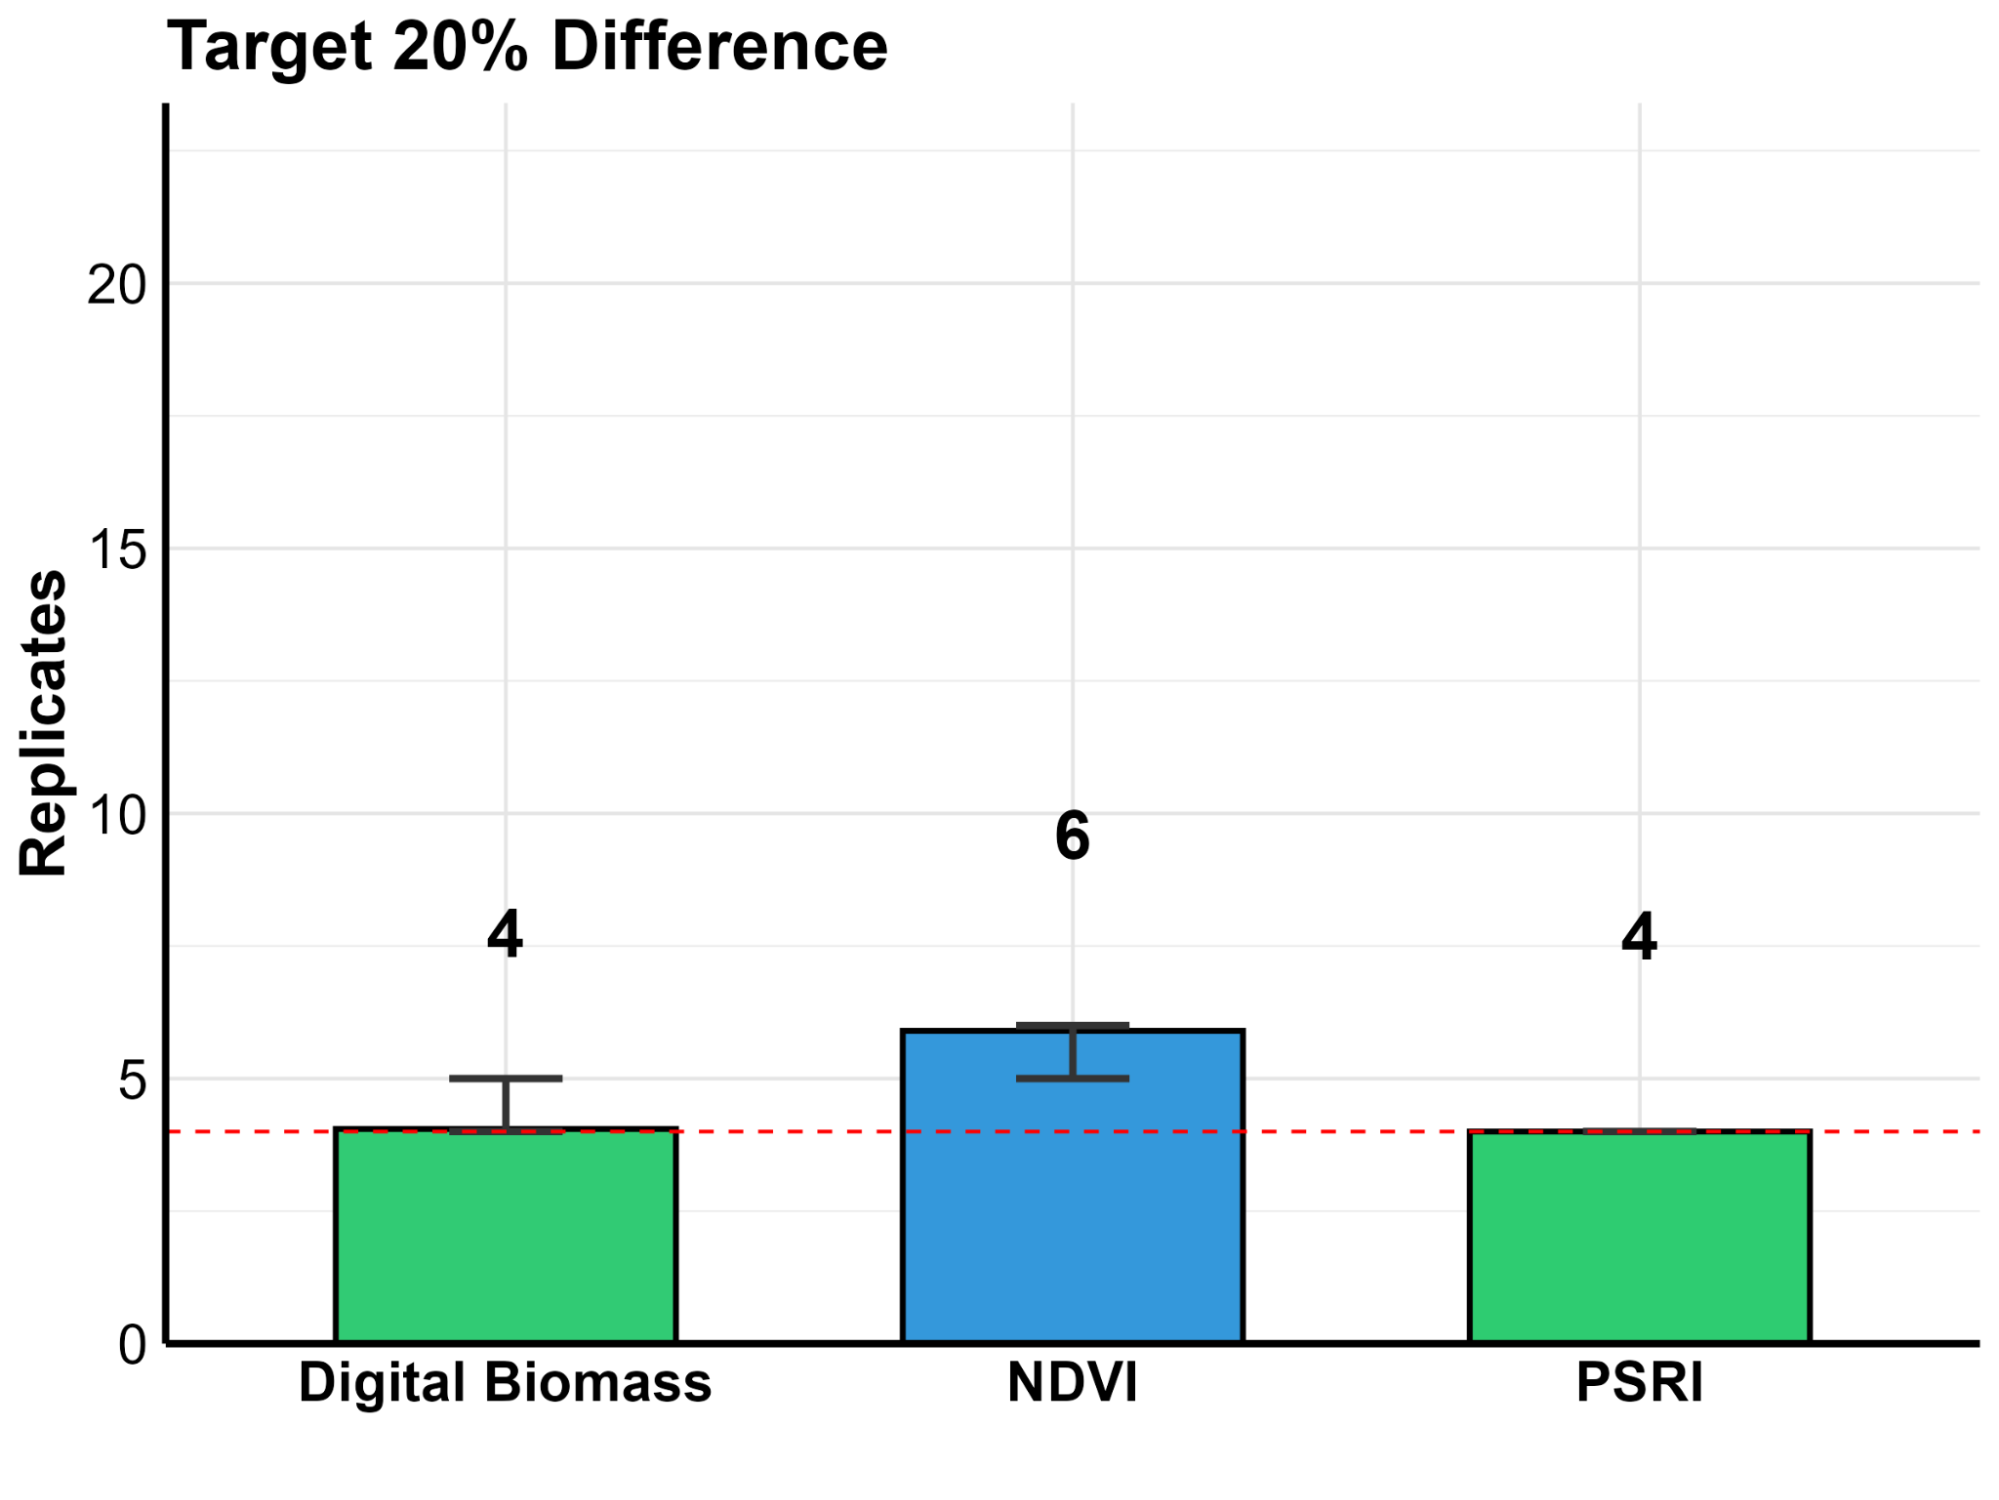 |
| Figure 5: Number of replicates required to statistically validate changes of 10%, 15%, and 20% in Digital Biomass, NDVI, and PSRI. Values are derived from 6,000 virtual simulations to ensure 80% statistical power. The red dashed line indicates the current experimental sample size (n = 4). | ||
Our power analysis quantifies this high-speed precision into two clear categories:
- ✔
High Sensitivity for Rapid Screening: With only 4 replicates, the system is powerful enough to detect a 26% difference in NDVI. This is ideal for fast “pass/fail” screenings. - ✔
Micro-Difference Detection for Subtle Gains: By increasing the sample size to 17 replicates, the precision sharpens significantly. This allows researchers to statistically prove a subtle differences in plant health.
From Manual Constraints to Scalable Discovery
The transition from manual sampling to automated phenotyping is more than a matter of convenience; it is a fundamental shift toward data integrity. As this trial demonstrates, the traditional reliance on handheld SPAD meters—while historically useful—creates a bottleneck that limits both the pace and the objectivity of modern plant science.
By removing the variables of human bias and position effect, PlantEye transforms chlorophyll assessment from a labor-intensive task into a seamless, high-fidelity data stream. The result is a research environment where high-replicate counts are no longer a luxury, but a standard that drives high-confidence discovery.
Ultimately, PlantEye provides the tools to outpace the traditional limitations of the field. By automating the “how” of trait assessment, we empower you to focus on the “why”—accelerating the development of resilient crops and sustainable agricultural solutions without compromising on precision or resources.
With the analytical power of HortControl, the result is a research environment where high-replicate counts are no longer a luxury, but a standard that drives high-confidence discovery.
Contact us for more information
Would you like more information on how to replace manual SPAD measurements in your workflow with our digital phenotyping solutions? Contact us now: