
PlantEye F600
Multispectral 3D scanner for plant phenotyping
PlantEye is a unique plant phenotyping sensor that combines 3D vision with multispectral imaging. This patented technique captures plants non-destructively and delivers precise and objective plant parameters on plant morphology and physiology. Our tools fully automate the phenotyping process and create insights in plant growth or changes in health.
-
- 3D models with Multispectral data – Patented technology
- 20+ Plant parameters each scan – Morphological and Spectral plant parameters
- High throughput – Scan thousands of plants multiple times a day
- Non-Invasive plant screening – No harvesting or moving
- All environments – Scan in direct sunlight, rain & rough conditions
- Precise & Objective – Reproducible plant data
For applications where detailed information or high numbers of plants are required. The PlantEye is built with high quality standards to operate in any environment like growth chambers, labs, greenhouses and fields.
Plant Phenotyping automation, our process:
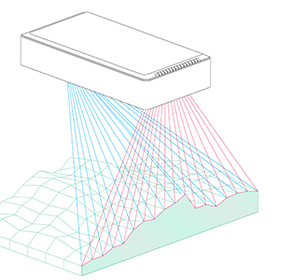
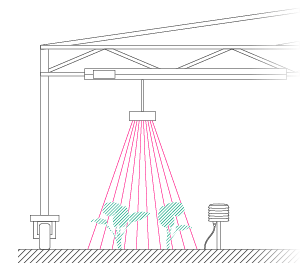
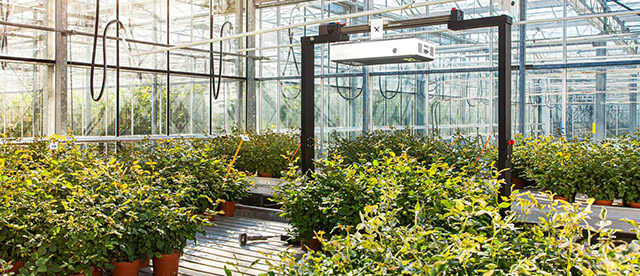
PlantEye moves over your crops and captures them in 3D and with multispectral information
The PlantEye moves over the plants, with its patented technology it creates unique 3D Models including high quality spectral information. During the 3D acquisition a flashing unit illuminates the plants and measures 4 wavelengths of the plant in high frequency. This way we can overlay 3D and multispectral information in one file and in high quality, without the need for slow complex sensor fusion algorithms or error prone image overlaying. Hence we provide both morphological and physiological parameters in one shot.
- 3D and Multispectral data combined
- High precision
- Independent of lighting conditions
- Fully automated
- High scan interval – Scan day and night
Many phenotyping devices require the plants to be moved. This is expensive, limits the throughput, impacts the plant and well, sometimes you just cannot move the plant as it grows in the soil. That is why we bring the sensor to the plant.
3D Plant Model is generated to calculate plant Parameters
A 3D model of your plant, tray, plot or even entire field is generated by PlantEye. The model is stored as an open PLY format. The plant model is built out of points called a 3D point cloud. Every point contains the following information:
- x, y, z coordinates in space
- Reflectance in Red, Green, Blue, and Near-Infrared
- Reflectance of the 3D Laser (940nm)
The 3D model is stored and can be accessed in HortControl or any other 3D software. Raw data and computed plant parameters are available as open source files. From these 3D models we calculate all plant parameters needed for your research or your application in real time.
Maize stage V11 | RGB | Dual scan | Click, move & scroll to rotate and zoom the 3D model
The spectral information from the 3D models enable us to calculate different spectral indices like NDVI or PSRI. For example the NDVI model (below) allows us to calculate many parameters related to plant senescence like healthy and unhealthy foliage.
Wheat – Dense canopy (Field conditions) | NDVI | Dual scan | Green is healthy plant tissue, Yellow is unhealthy tissue, orange/red is dead tissue, soil or other artifacts.
20+ plant parameters can we measure
Visualize plant growth with a wide variety of morphological parameters such as:
- Plant Height Max
- Plant Height Average
- Canopy Light Penetration Depth
- 3D Leaf Area
- Projected Leaf Area
- Digital Biomass
- Convex Hull Area
- Convex Hull Area Coverage
- Convex Hull Circumference
- Convex Hull Maximum Width
- Convex Hull Aspect Ratio
- Voxel Volume Total
- Surface Angle Average
PlantEye measures the RGB & NIR spectral reflectance of the plant. Each wavelength can be statistically analyzed individually to calculate and quantify:
- HUE average (Color)
- Lightness average
- Saturation average
RGB & NIR Wavelengths are combined into spectral indices. At the moment we can calculate the most important indices like:
- Normalized Digital Vegetation Index (NDVI)
- Normalized Pigments Chlorophyll ratio index (NPCI)
- Plant Senescence Reflectance Index (PSRI)
- Green Leaf Index (GLI)
- More are developed continuously
Studies show that the applications below can be derived from, or correlated with, one or more of our physiological plant parameters.
- Disease quantification
- Plant healthiness
- Plant senescence
- Chlorophyll levels
- N-Content
Start Analyzing & Visualizing your data with HortControl
HortControl is the central software to setup your experiments and to store and manage your data locally on your site. Within seconds after the scan, the plant parameters sets can be visualized and analyzed with the HortControl tool box.
- Set up and control experiments
- Visualize, aggregate and export data
- Automated reports e.g. germination report or growth report
HortControl is highly user friendly and designed to be used by staff with any professional background. You can access HortControl from your office or in the field. Read more >
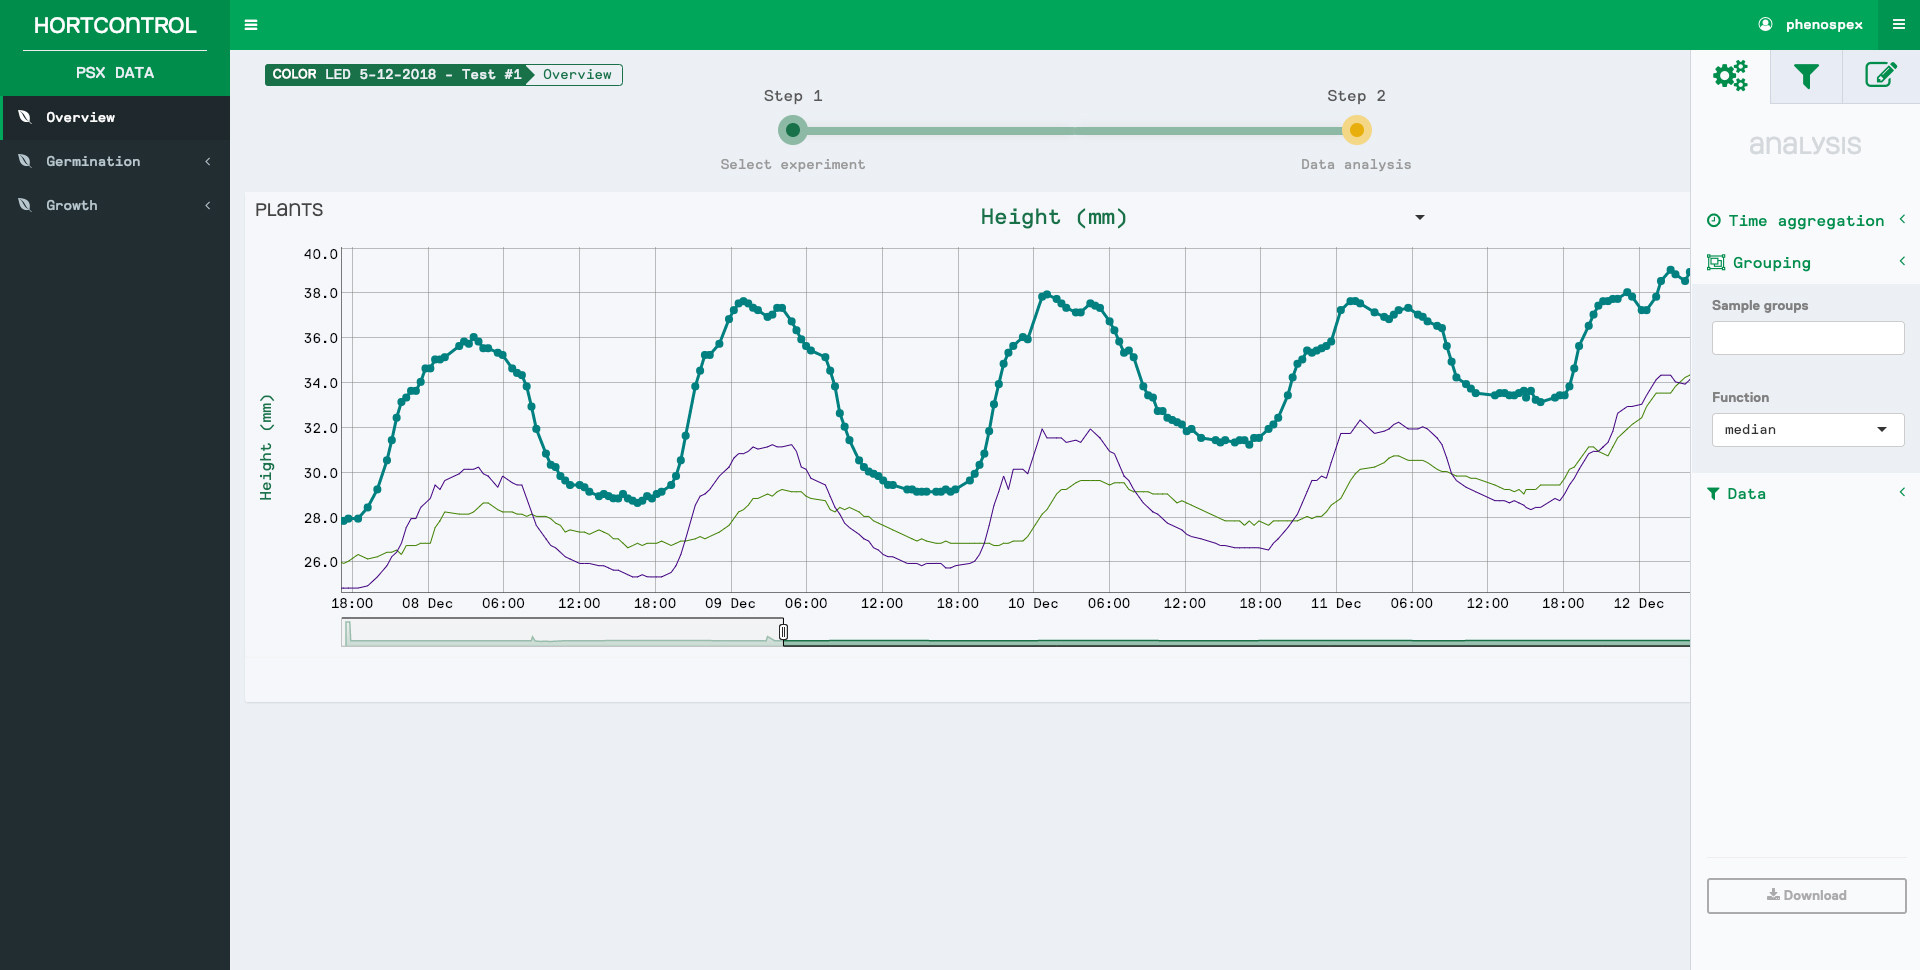
Growth dynamics of tomato plants (height in mm) visualized over time. The high scan intervals reveal leaf movements over the the day showing the benefit of high quality and throughput in digital plant phenotyping.
Applications
Clients worldwide successfully use the PlantEye for the following applications:
- Plant phenotyping
- Disease Screenings
- Efficacy screening
- Disease quantification
- Germination assays
- Bio assays
- Quality control
- Plant monitoring for vertical farms


Full automation PlantEye products:
Easily Implement PlantEye in your phenotyping process Lab, Greenhouse and field research.
Digital plant phenotyping everywhere
- Easy integration
- Lab and Greenhouse
- Easy transport and setup
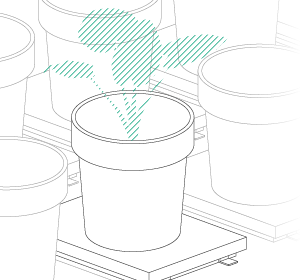
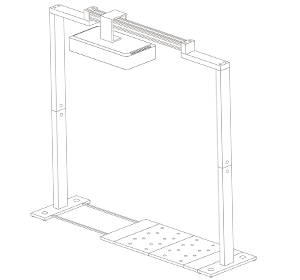
The MicroScan is a flexible tool to automates your small digital phenotyping tasks on location. It is also an ideal tool for those who would like to start testing with the digital assessment of crops. read more
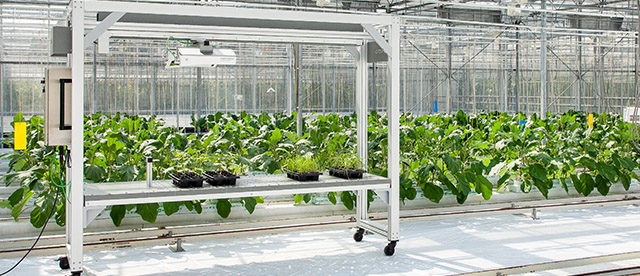
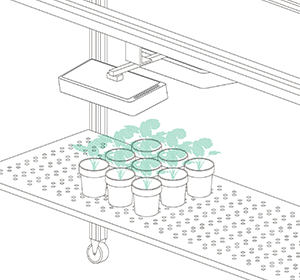
Easily automate your plant phenotyping
- Easy integration
- Lab and Greenhouse
- Scan up to 100 plants in each minute
The TraitFinder is designed for applications in labs, climate chambers and greenhouses and scans and analyses between 5-100 plants in a single scan. It uses the PlantEye Sensor and extracts a wide suite of morphological- and physiological parameters. read more
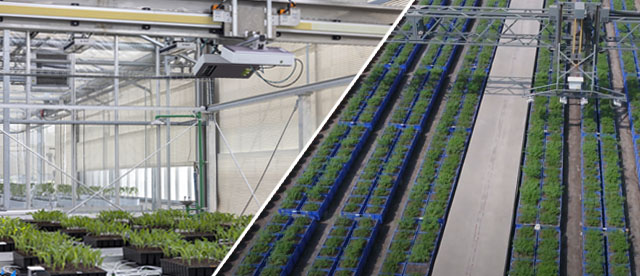
Scan thousands of plants in greenhouses and fields
- High Throughput, scan thousands of plants each hour
- Greenhouse and field
- Even in direct sunlight
Use FieldScan in plant research or breeding and combine high-precision phenotyping with high throughput. Improve the quality of your research with an entire new dimension of plant data. read more.
Download a set of 3D files generated by PlantEye. Additionally it contains images of the 3D files and a help doc on how to work with the 3D files in the open source 3D software CloudCompare.
Enter your email to receive the download link.
Technical Specifications:
| PlantEye F600 – 3D plant phenotyping | |
| Plant Parameters | 20+ |
| Spectral bands | 5 (RGB & NIR) |
| Weight | 10.1 kg |
| Dimensions | 451 × 230 × 90 mm |
| Operating temperature | 0-40 °C |
| Humidity | 0 – 100% rel. |
| Connectivity | Gigabit Ethernet |