
Field Phenotyping – A development story
There are several challenges when developing field phenotyping platforms for plant science and plant breeding. For us, it is always important to bear the scientific questions in mind before suggesting any technological solutions. In this blog entry I want to tell the story of how we developed a field phenotyping system for Vincent Vadez and his team at ICRISAT. As is the case with every interesting journey, the story of how we developed FieldScan involves several strands. It is a tale of many scientific discussion, several lessons learnt, and rewarding results.
The scientific discussions
Field phenotyping has become a buzzword in recent years. I think, in order to provide meaningful solutions, we have to ask intelligent questions before developing technologies. As a plant physiologist, I want to fully understand the research our customers are conducting.
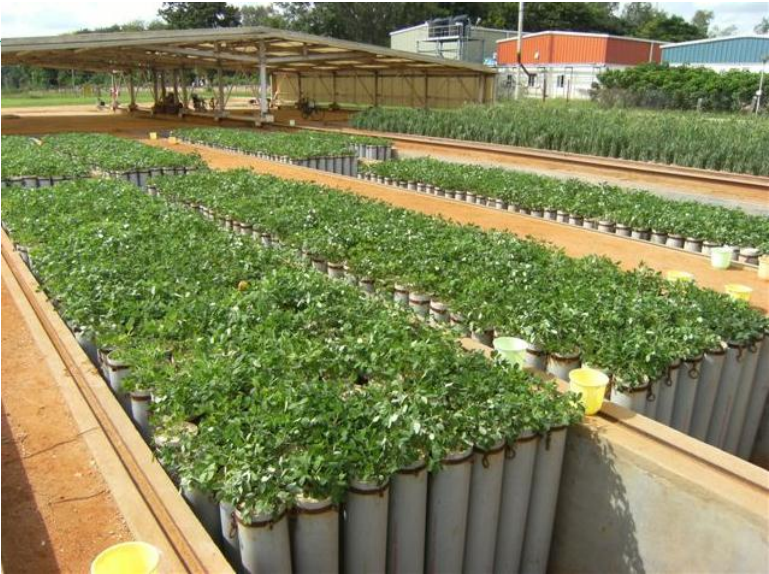
Vincent demonstrated that in his setup, the difference between a drought resistant- and a drought sensitive genotype was not caused by a different root system in terms of size, biomass or architecture, but rather by different extraction patterns of water over time. He obtained this data by assessing transpiration rates of hundreds of plants growing in huge tubes measuring 2 metres in length and containing 150 kg of soil – an extensive but rewarding chunk of work. He showed that the accumulated water extraction was the same for all genotypes over time. The difference between resistant and non-not resistant genotypes was the point in time at which the water was extracted, and the rate at which it was extracted. Genotypes sensitive to terminal drought transpired much more in early in the developmental stages than their resistant counterparts, which had significantly higher transpiration rates in the grain filling period. In short: genotypes with high transpiration rates in early stages were depleted of water later on, when water was needed for the grain filling period. Genotypes with a more sustainable water extraction pattern, or a water saving trait, had a benefit when the time came to fill up their grains. A stunningly simple method, still keeping one question open: how do plants control these different extraction patterns? Of course, Vincent had some answers.
Transpiration is tightly closely linked to the growth or the expansion of leaf area – the bigger the leaf area, the higher the transpiration. Hence, initially fast- growing plants already deploy their water reserves compared to genotypes with modest growth rate at the beginning and accelerated growth in later stage. Therefore, the growth pattern also defines the pattern of extraction of water from the soil. As a consequence, by choosing examining growth patterns, water extraction patterns or strategy can be defined as well. Vincent presented a second finding, which he obtained from controlled dry down experiments. Some genotypes kept on transpiring continuously, even at very low water availability, while other genotypes were more sensitive and reduced transpiration rates earlier.
A further “water-saving-trait” presented by Vincent demonstrated how plants regulate their canopy conductance (amount of water transpired per leaf area) in function of the VPD (vapour pressure deficit), which is the driving force for transpiration. Some plants still have high canopy conductance at high VPD, while other genotypes down-regulate and thereby save soil water.
The hard lessons in field phenotyping
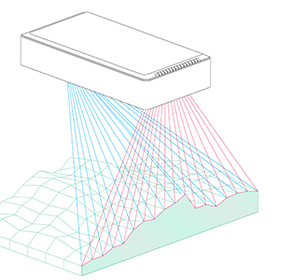
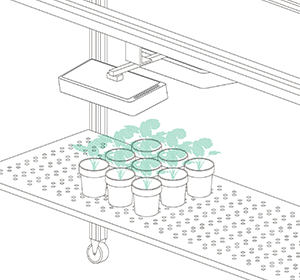
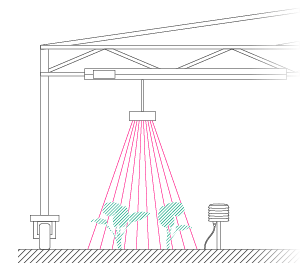
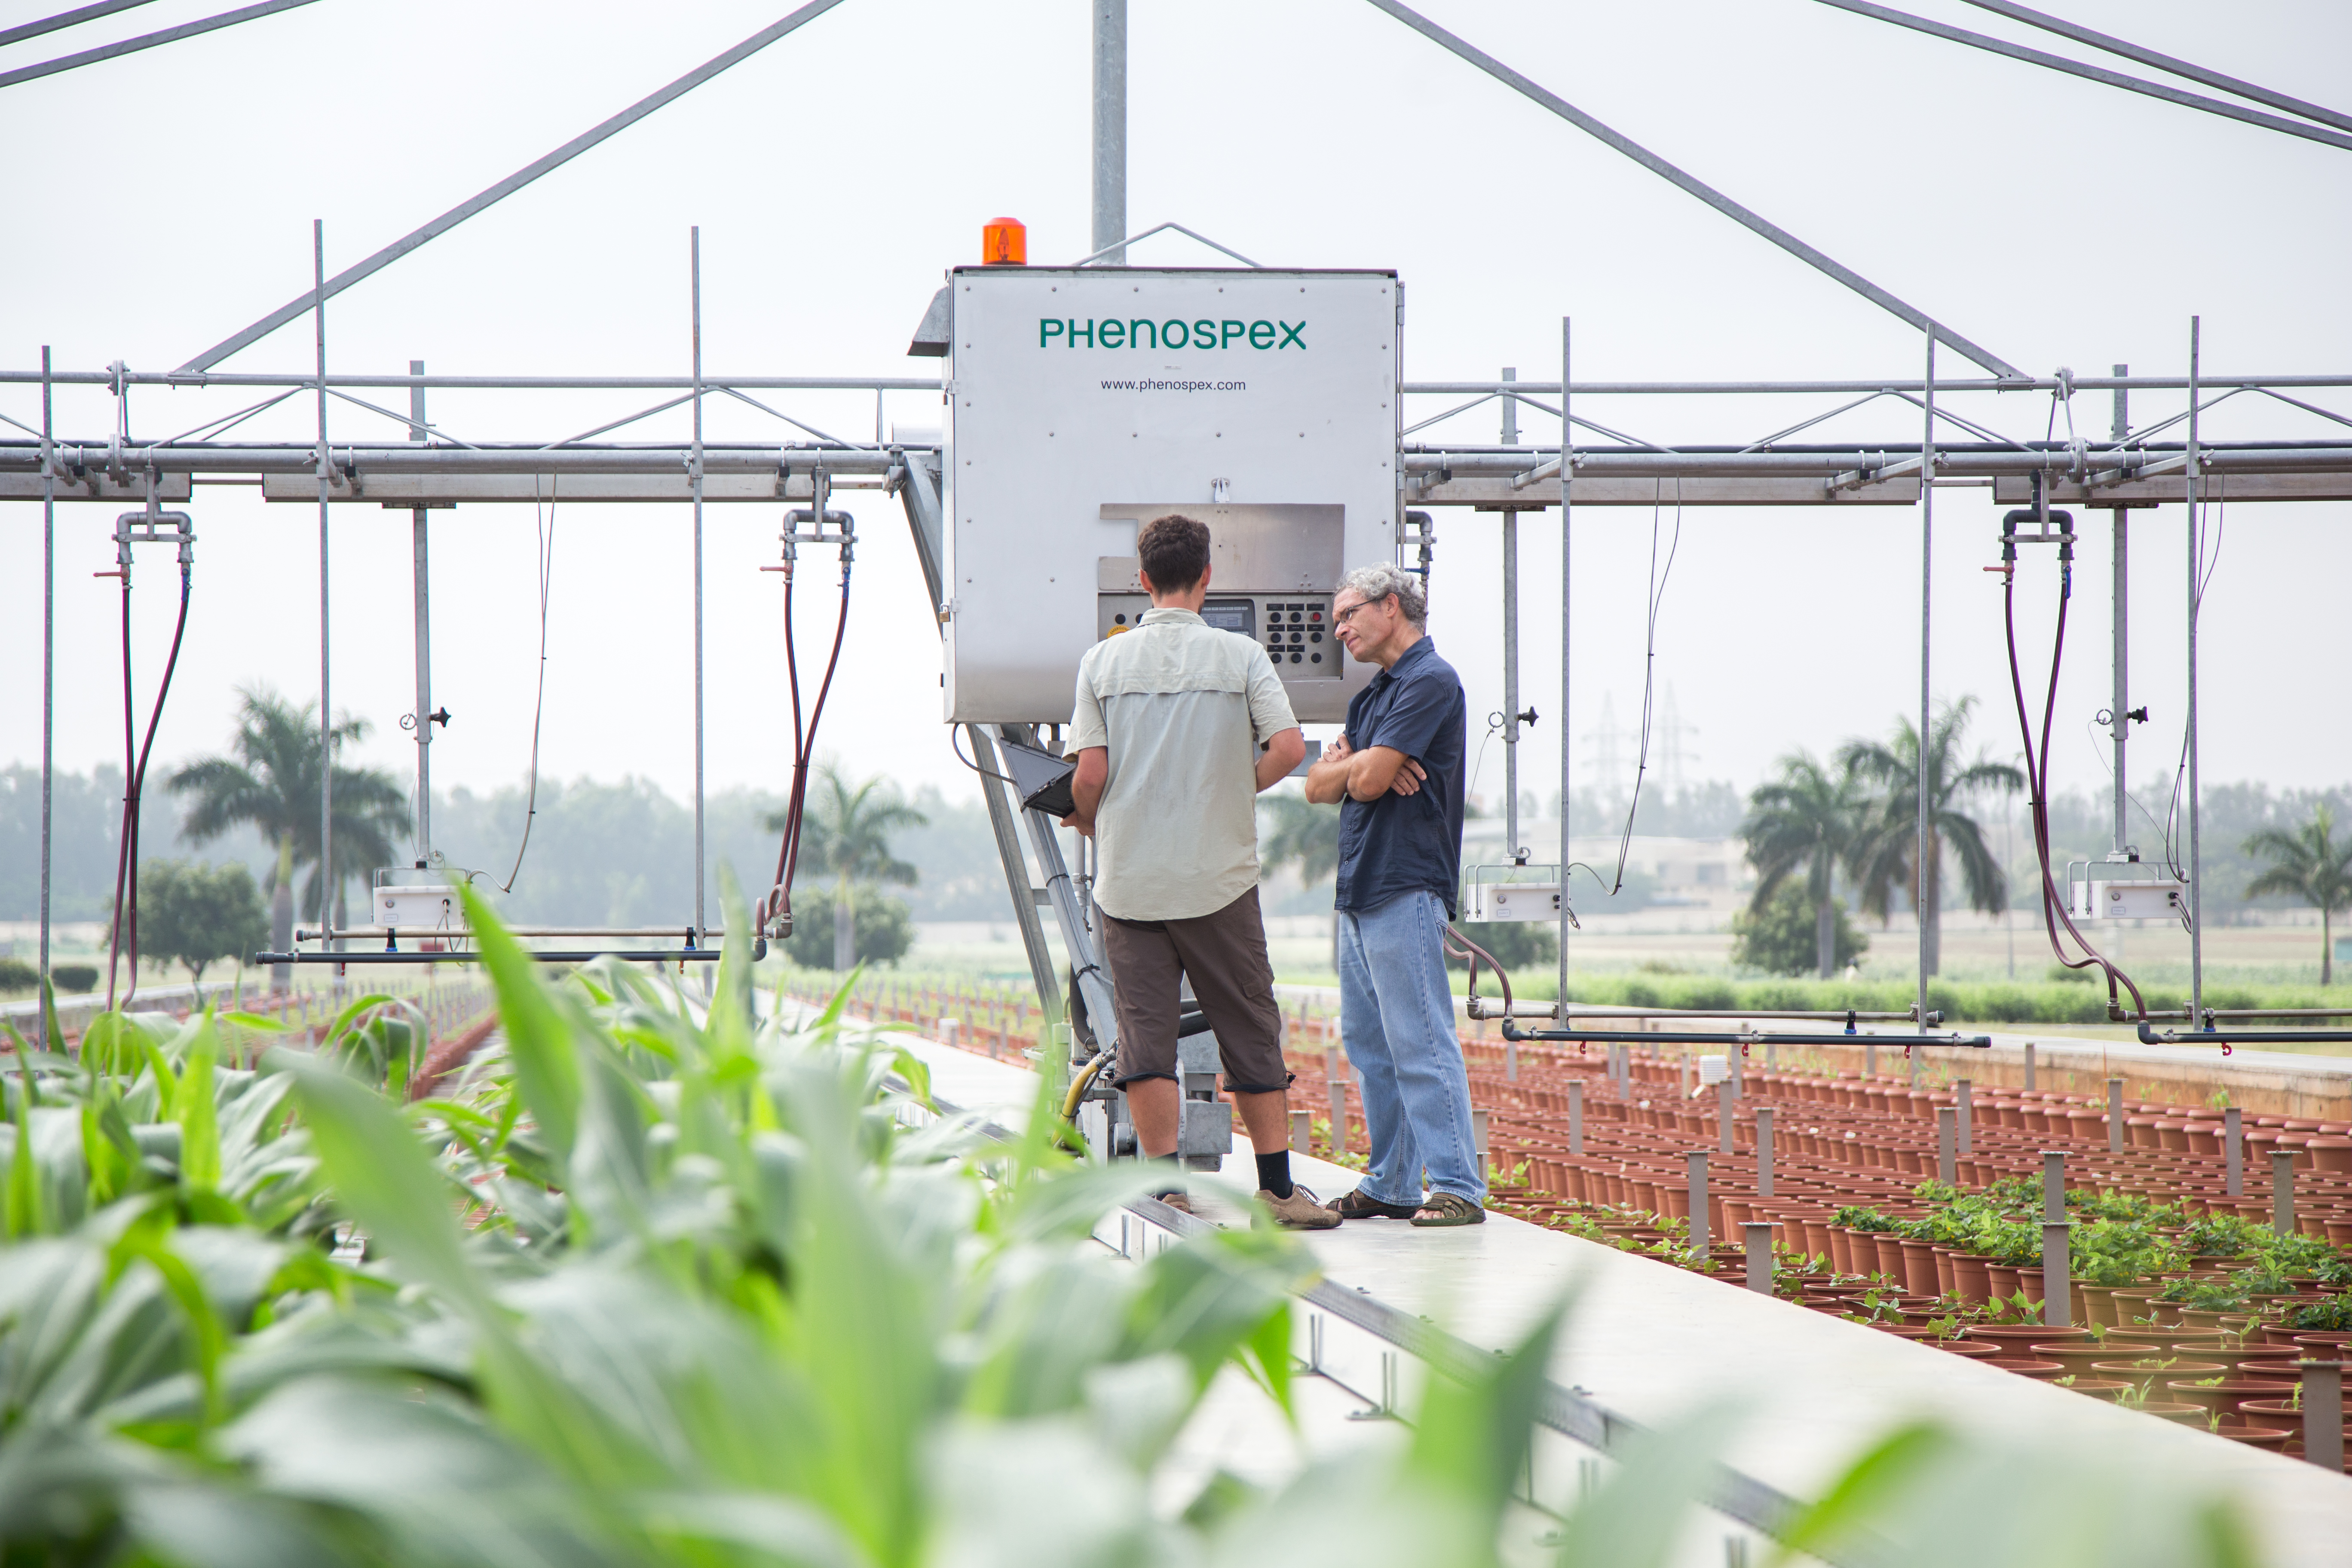
Bearing these scientific questions – and the methods evaluated by Vincent and his team – in mind, Phenospex entered the game. The idea was very simple: we needed to screen large populations and assess the genetic variability of how plants display their leaf area in function of time, and, secondly, track the rate of transpiration. To assess growth rates, Vincent rented our PlantEye laser scanner and conducted numerous validation experiments. Although PlantEye works well in Central Europe, we faced a couple of challenges in India where the sensor was operating at temperatures of up to 45°C (in shade!) and sunlight intensity was almost twice as high. This is not simply another league – it’s a totally different game! Basically, we not only had to battle the high temperatures – which strongly affect the laser diode and camera system – but the intensive sun also made it impossible to measure during the day. After some struggles, however, our engineers delivered a terrific machine, the PlantEye F400. This enabled Vincent to gather first class data, even at noon under full sunlight and at the highest possible temperatures.
The rewarding result
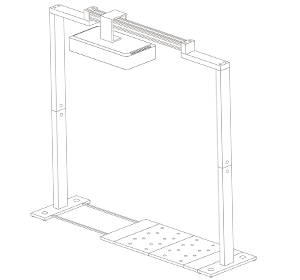
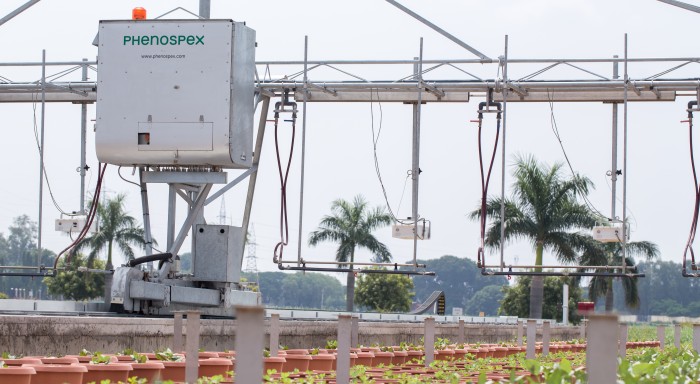
Vincent and Jana (his assistant) were convinced by their findings after they finished their last validation experiments. Our job was now to scale up the platform. For Vincent, the goal was clear: a semi-field platform to screen a population of at least 500 genotypes with a significant amount of replicates. We ended up with a platform for over 10,000 plants and a throughput of 5,000 plants/h. The reason for this outstanding throughput was to enable us to have at least one valid measurement per day, independent of wind, rain or other events which strongly affect plants and therefore the quality of gathered data. Moreover, we knew from validation experiments that some of the plants (especially groundnut) show strong diurnal patterns, which means that leaves move considerably throughout the day – hence if you are not quick enough, you might measure some nice leaf movement, but not growth! To move the sensors over the platform and to assess the plants, we developed a sensor carrier device together with one of our horticultural partners. The system is now able to screen 10,000 plants in 2h with a precision of a couple millimetres.
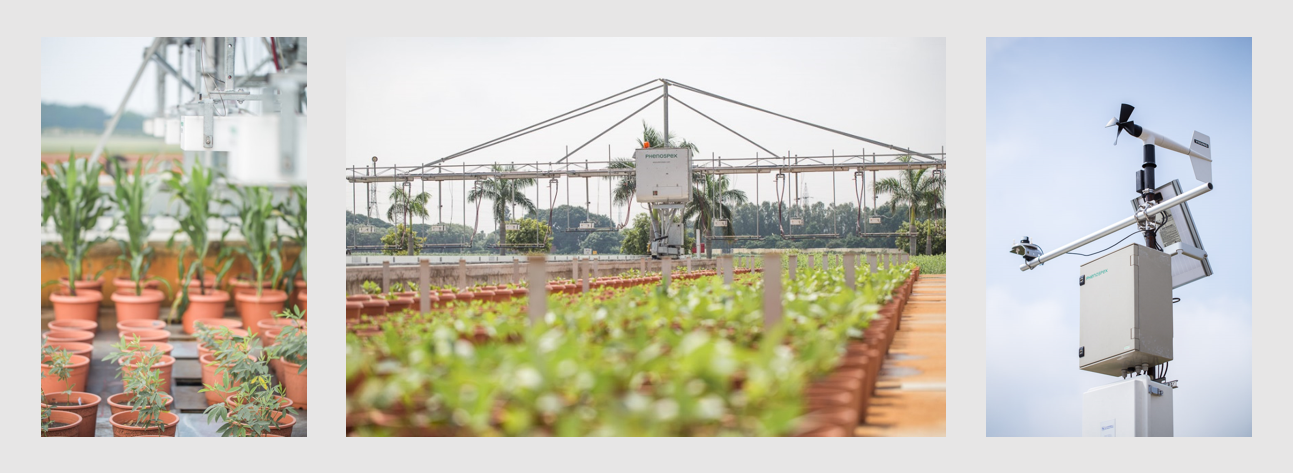
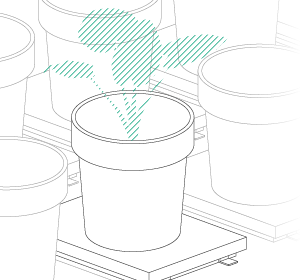
The last challenge we faced was to continuously assess the transpiration rates of all plants over the day. After some in-house experiments, we developed a rugged balance, which can be set up in the field, and which carries one or two 50kg or 100kg pots, depending on the experimental design. Each of the balances can be polled in parallel every 5 minutes, providing the transpiration dynamics of each individual pot throughout the day. The platform was called LeasyScan at ICRIAT and it has been in operation since May 2014 – we just call it FieldScan. Details have been submitted to several publications and we will keep you posted.
Both the technical development process of this system and the lessons we learned together with ICRISAT helped us to more fully understand what is really needed in phenomics and breeding. For us, the most rewarding result was an adaptable platform that perfectly suits the needs of Vincent and his team, delivers meaningful results, and can be used for various other applications with limited adaptations. After this experience, we are convinced that by listening and working hard, we can create better tools for better research.